• Inventory Builds, Sales Slow •

The San Diego real estate market pumped the brakes in July, as closed sales fell while new listing inventory continued to build. Home sales saw double-digit declines in closings compared to last year, despite more listing inventory hitting the market in July. San Diego home Buyers are taking their time, with many waiting for clearer signals on rates and pricing before making moves.
Detached home sales were down 10.0 percent year-over-year in July 2025 compared to last year in July 2024, while attached home sales – including condos and townhomes – slipped 10.7 percent. Days on market rose sharply, climbing 52.6 percent to 29 days for detached homes and 40.0 percent to 42 days for attached, signaling a slower pace and more room for negotiation.

July 2025 San Diego Housing Market Update
San Diego home prices showed a mixed trend in July. The median sale price for detached homes rose 4.7 percent year-over-year to $1,099,000, reflecting ongoing demand for standalone properties in desirable locations.
On the flip side, attached homes like condos and townhomes dipped 7.1 percent to a median sale price of $650,000, showing fewer home sales and more volatility in this segment.


Inventory growth continued to reshape the landscape as more Sellers listed new homes for sale this July. Detached listings climbed 22.8 percent, while attached listings – including condos & townhomes – jumped 38.1 percent from July 2024.
This growing supply of new listings available for sale in San Diego gives you a surplus of options to choose from and more bargaining leverage, while higher home prices and rate sensitivity keep the real estate market balanced for now.

San Diego Zip Codes with Most Homes Sold July 2025
In July, the top zip codes in San Diego County with the most home sales were:
• 92028 (Fallbrook) with 46
• 92056 (Oceanside East) with 40
• 92021 (El Cajon) with 34
• 92117 (Clairemont) with 32
• 92024 (Olivenhain), 92026 (North Ridge), 92027 (East Valley), 92058 (Oceanside), and 92065 (Ramona), all tied with 31
These Inland San Diego zip codes draw attention for delivering larger homes at a favorable price point, with a competitive cost per square foot. For many Buyers, these neighborhoods east of the coast hit the sweet spot, offering more home for the money yet still close to parks, shops, and schools.
They’re close enough to enjoy an easy commute and quick freeway access to the coast, without paying the premium for waterfront or West of I-5 addresses. In these Inland communities, Buyers put square footage and breathing room ahead of being by the shore.

Most Expensive House Sold in San Diego July 2025
The most expensive house sold last month during July 2025 in San Diego County was a showstopping gated single-story estate perched in the ultra-exclusive Del Rayo Estates enclave of Rancho Santa Fe. Sold fully furnished with museum-quality art, this gated new construction retreat was designed to impress at every turn, blending sleek finishes with design-forward living across one of the most private ridgeline settings in San Diego.
Set on over 2 hilltop acres, this sprawling single-level home spans roughly 12,000 square feet with zero steps, combining massive scale with bespoke design details from around the world. A lush and inviting open-air courtyard leads to sweeping indoor-outdoor spaces, a 65-foot covered pavilion, and a temperature-controlled wine wall backed by rare Patagonia stone. Every detail was curated to inspire and flow into the floorplan, from the 8-car garage and private guest house to the spa-inspired bathrooms with dual dressing suites.
It sold on July 28th for $18,000,000. Listed by Laura Barry and Jim Graves at Barry Estates. MLS# 250027355.


San Diego Housing Market Real Estate Data
This snapshot of the latest San Diego real estate stats reflects activity and pricing from last month in July 2025, comparing key indicators year-over-year during July 2024. With supply trending upward and days on market extending, Buyers are regaining some leverage.
Growing inventory of homes available for sale is rebalancing San Diego home prices. Read on for a detailed analysis of this historical data and what impact these metrics have on Sellers, Buyers, and real estate trends around your neighborhood in San Diego.
Data on the current housing market in San Diego is compiled by the Greater San Diego Association of REALTORS® (SDAR) through the San Diego Multiple Listing Service (SDMLS).
Sources:
https://sdar.stats.10kresearch.com/docs/mmi/2025-07/x/report?src=page
https://nsdcar.stats.10kresearch.com/docs/lmu/x/SanDiegoCounty?src=map
https://media.sdar.com/media/CurrentStats.pdf

san diego housing market update, san diego real estate today, real estate news san diego, housing market decline san diego, real estate market bubble burst, san diego housing market crash, latest update on real estate market, san diego housing market article, current housing market update san diego, san diego real estate market explained, housing market forecast san diego, housing market correction san diego, housing market going up again, why is the housing market going up again, san diego housing market news, portia green realtor, reali housing market update san diego, redfin housing market updates san diego, zillow housing market updates san diego, realtor.com housing market update san diego, realtor near me san diego, how much does it cost to sell a house in san diego, how much does it cost to buy a house in san diego, san diego real estate data, san diego housing market, how to win a bidding war in san diego, opendoor housing market updates san diego, homes.com housing market updates san diego
About The Author

Related Posts

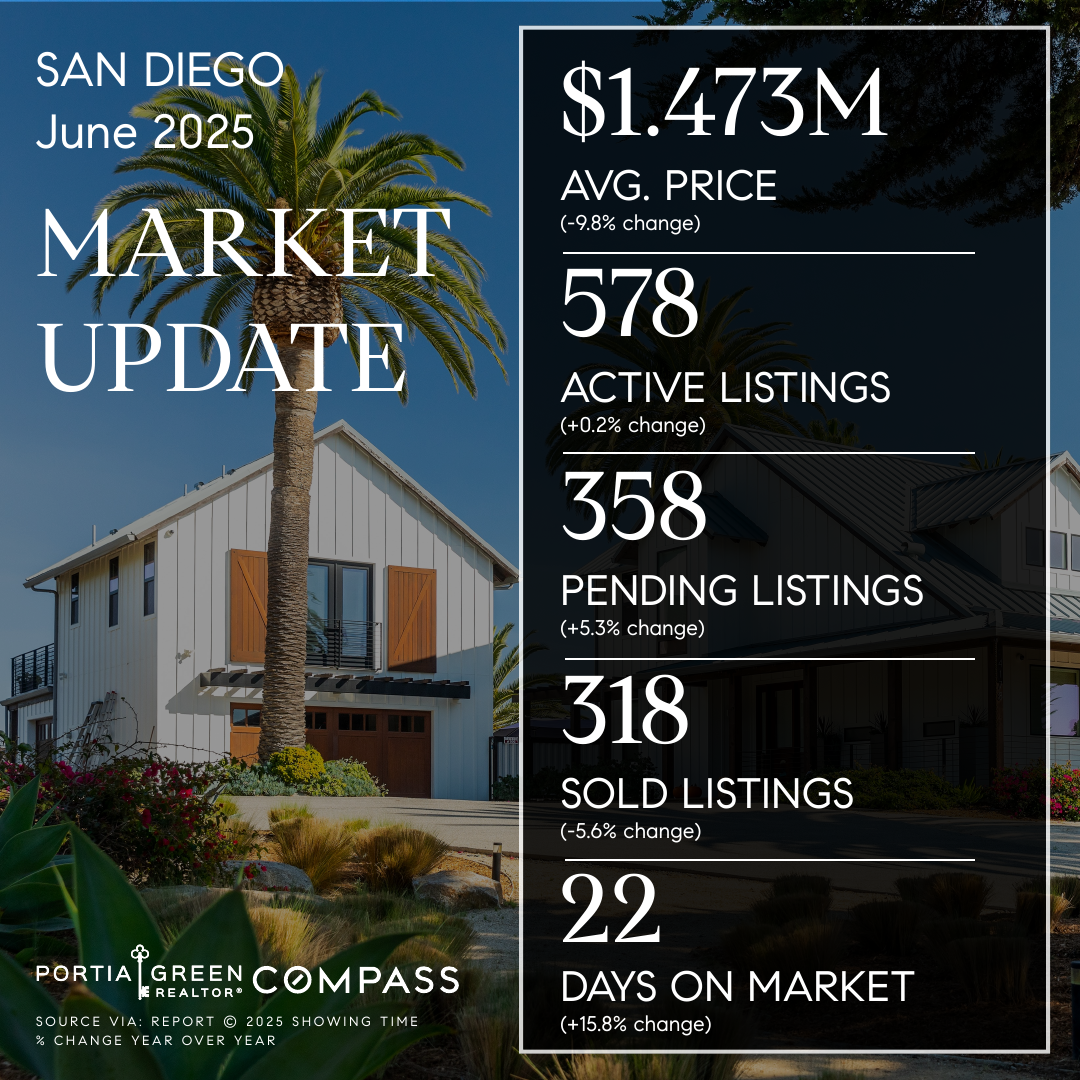
San Diego Housing Market Update — June 2025
• Inventory Grows, Demand Holds • The San Diego housing market continued…
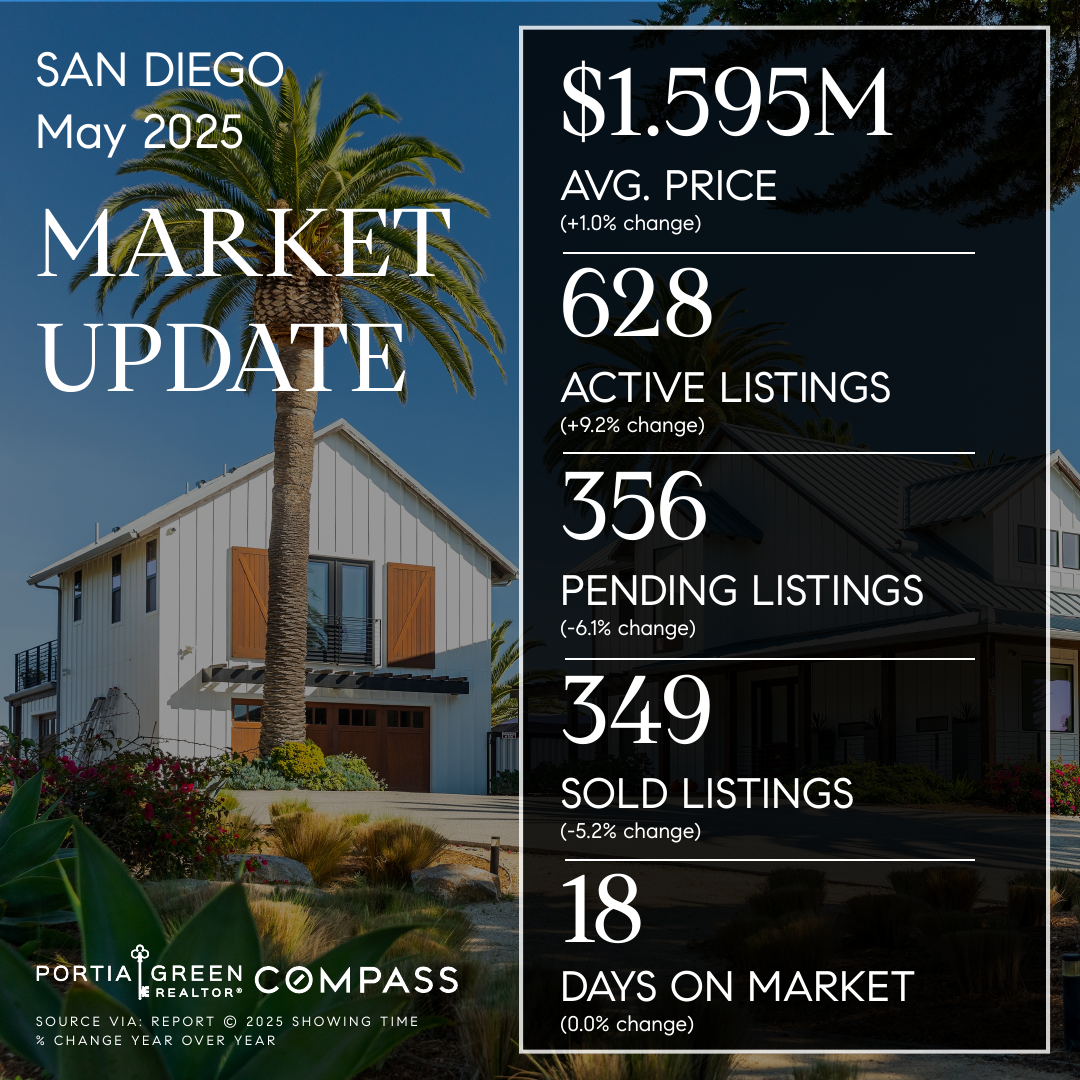
San Diego Housing Market Update — May 2025
• Listings Spike, Sales Dip • The San Diego housing market settled…
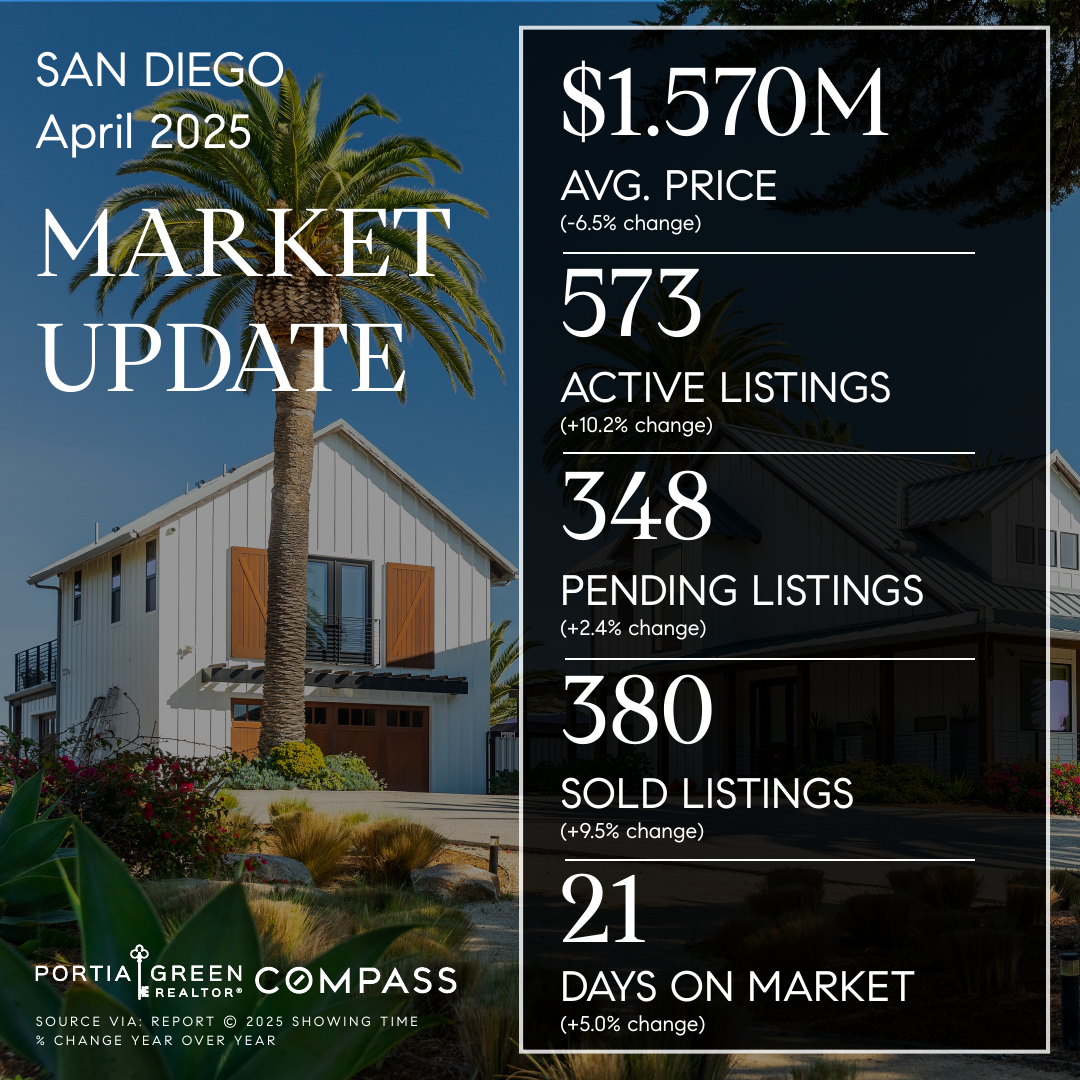
San Diego Housing Market Update — April 2025
• Sales Jump, Prices Cool • The San Diego housing market shifted…