• Inventory Grows, Demand Holds •

The San Diego housing market continued its shifting pace in June, with closed sales ticking down slightly while new listings continued to climb. As part of an ongoing rebalancing, Buyers remain measured as they navigate more options brought on by rising inventory and evolving price patterns across San Diego County.
Detached home sales dropped 2.2 percent year-over-year in June 2025 compared to last year in June 2024. Attached home sales, including condos and townhomes, dipped 2.5 percent from the same time last year. Sold homes spent an average of 22 days on market, up from 18 days in June 2024, or a 15.8 percent increase.

June 2025 San Diego Housing Market Update
Even with fewer sales and more homes on the market, San Diego home prices held relatively steady as sales activity cooled and inventory climbed.
The median sale price for detached homes was nearly flat year-over-year, edging down just 0.9 percent to $1,075,000. Attached homes, like condos and townhomes, saw a slightly larger shift with prices down 4.4 percent to a median of $659,500. 

Inventory growth stayed strong as more San Diego Sellers listed new homes for sale this summer. Detached home listings rose 27.1 percent year-over-year, while attached listings – including condos & townhomes – increased 37.3 percent.
This expanding supply of new listings available for sale in Greater San Diego County gives you more flexibility to comparison shop, as mortgage rate sensitivity continues to influence both purchasing pace and decisions.

San Diego Zip Codes with Most Homes Sold June 2025
In June, the zip codes in San Diego County with the most home sales were:
• 92028 (Fallbrook) with 50
• 92128 (Rancho Bernardo East) with 37
• 92128 (Rancho Bernardo West) with 36
• 91977 (Spring Valley) with 32
• 92056 (Oceanside East) and 92078 (San Marcos) both with 29
These central Inland San Diego neighborhoods are trending because they offer more space for the price and carry strong value at a modest cost per square foot.
You’ll still find easy access to parks, shops, and highways near beaches and the coast without overpaying for West of I-5 prices by the waterfront. Around these Inland neighborhoods of San Diego, size and space take priority over coastal proximity.

Most Expensive House Sold in San Diego June 2025
The most expensive house sold last month during June 2025 in San Diego County was a rare hilltop compound perched high above the Covenant in Rancho Santa Fe. Spanning over 3.2 acres with distant ridgeline views on quiet orchard terrain, this gated custom estate lives like a private retreat designed for calm, movement, and reflection.
Lush outdoor foliage frames the elevated acreage, giving this spectacular estate a sense of floating above the valley floor while staying grounded in the landscape. Inside, over 9,000 square feet unfold in a sweeping single-story layout, blending crisp geometry with softened tones. The home includes 7 bedrooms and 7 bathrooms across the main residence and two separate guest houses.
Natural materials guide the airy layout, where lofty ceilings create a continuous balance of openness and stillness. A wine wall frames the dining space. The primary suite leads directly into a garden sanctuary. Trails lead straight from the edge of the lot into the Covenant’s expansive trail system, connecting the home to village life without relying on a car. It sold on June 4th for $12,250,000. Listed by Laura Barry and Jim Graves at Barry Estates. MLS# 250017942.


San Diego Housing Market Real Estate Data
This snapshot of the latest San Diego real estate stats from last month in June 2025 shows the percentage change year-over-year compared to June 2024. Growing inventory of homes available for sale is rebalancing San Diego home prices. Read on for a detailed analysis of this historical data and what impact these metrics have on Sellers, Buyers, and real estate trends around your neighborhood in San Diego.
Data on the current housing market in San Diego is compiled by the Greater San Diego Association of REALTORS® (SDAR) through the San Diego Multiple Listing Service (SDMLS).
Sources:
https://sdar.stats.10kresearch.com/docs/mmi/2025-06/x/report?src=page
https://nsdcar.stats.10kresearch.com/docs/lmu/x/SanDiegoCounty?src=map
https://media.sdar.com/media/CurrentStats.pdf

san diego housing market update, san diego real estate today, real estate news san diego, housing market decline san diego, real estate market bubble burst, san diego housing market crash, latest update on real estate market, san diego housing market article, current housing market update san diego, san diego real estate market explained, housing market forecast san diego, housing market correction san diego, housing market going up again, why is the housing market going up again, san diego housing market news, portia green realtor, reali housing market update san diego, redfin housing market updates san diego, zillow housing market updates san diego, realtor.com housing market update san diego, realtor near me san diego, how much does it cost to sell a house in san diego, how much does it cost to buy a house in san diego, san diego real estate data, san diego housing market, how to win a bidding war in san diego, opendoor housing market updates san diego, homes.com housing market updates san diego
About The Author

Related Posts

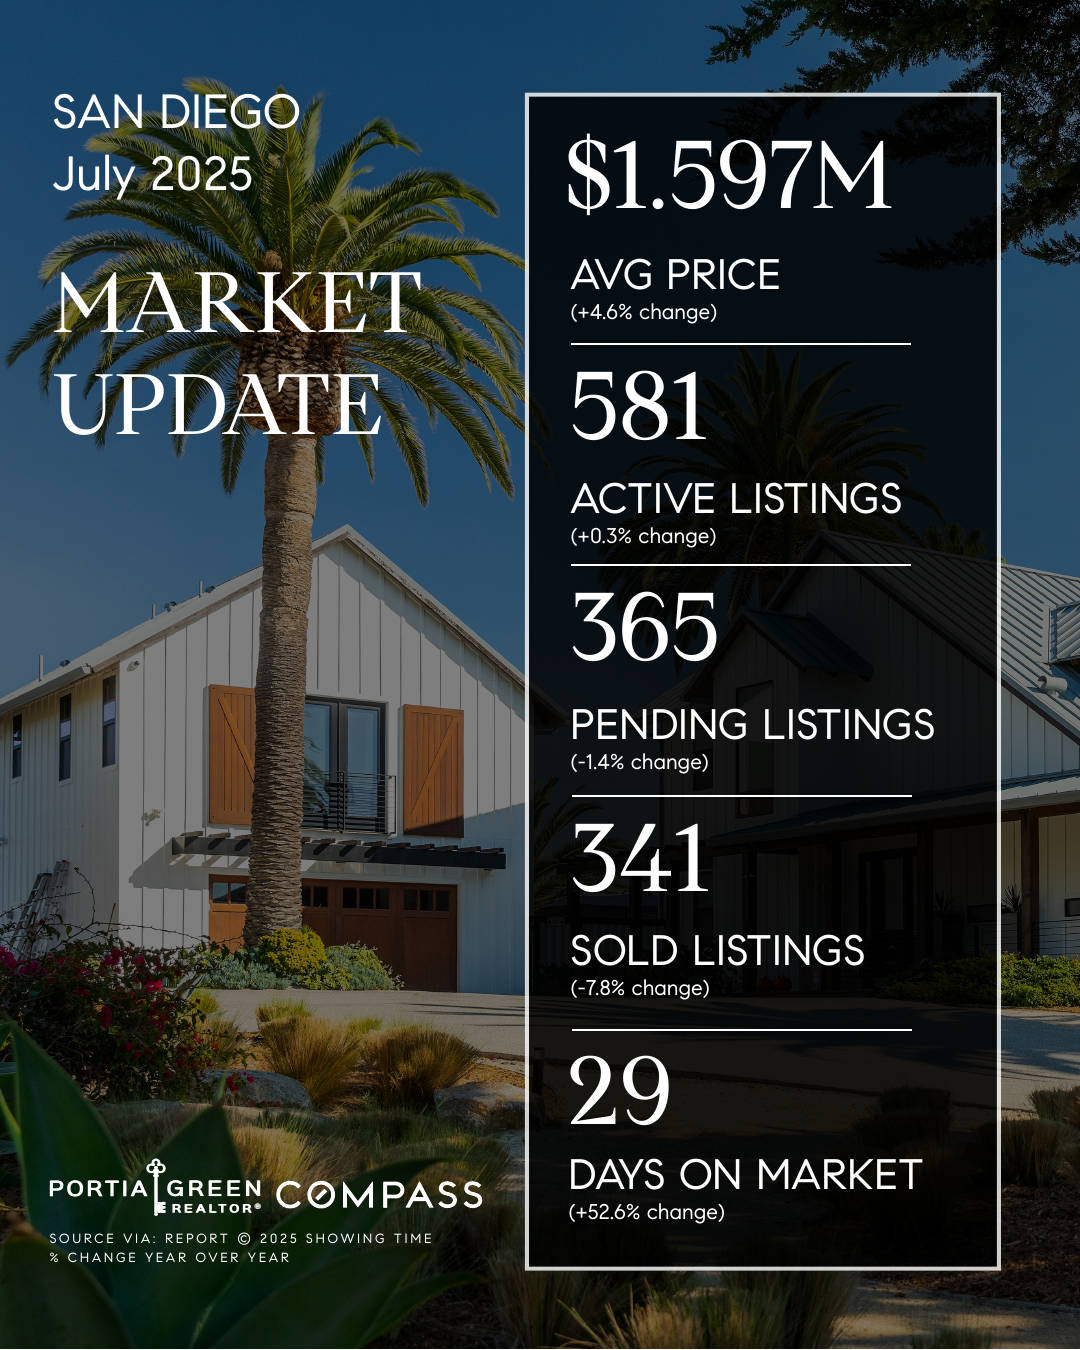
San Diego Housing Market Update — July 2025
• Inventory Builds, Sales Slow • The San Diego real estate market…
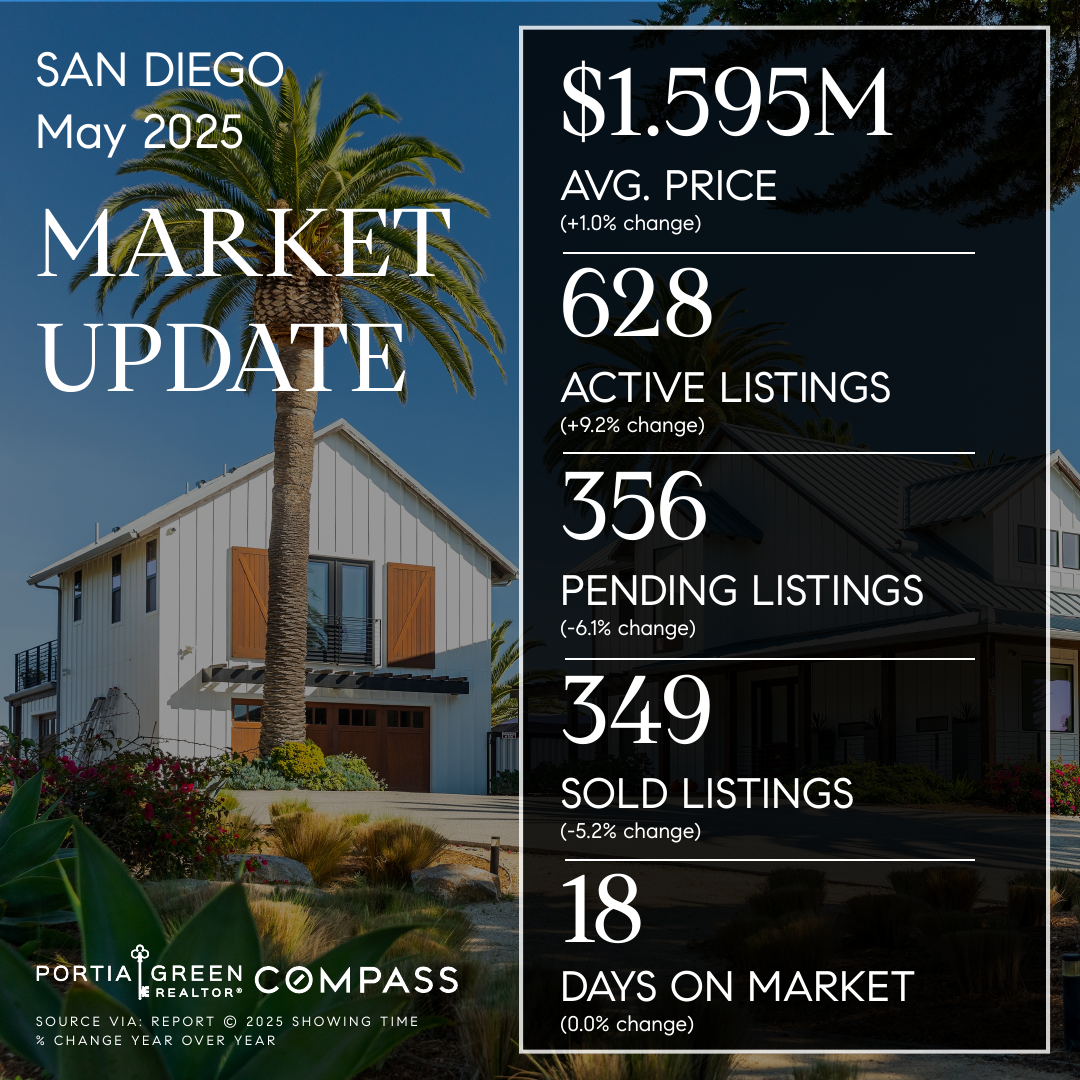
San Diego Housing Market Update — May 2025
• Listings Spike, Sales Dip • The San Diego housing market settled…
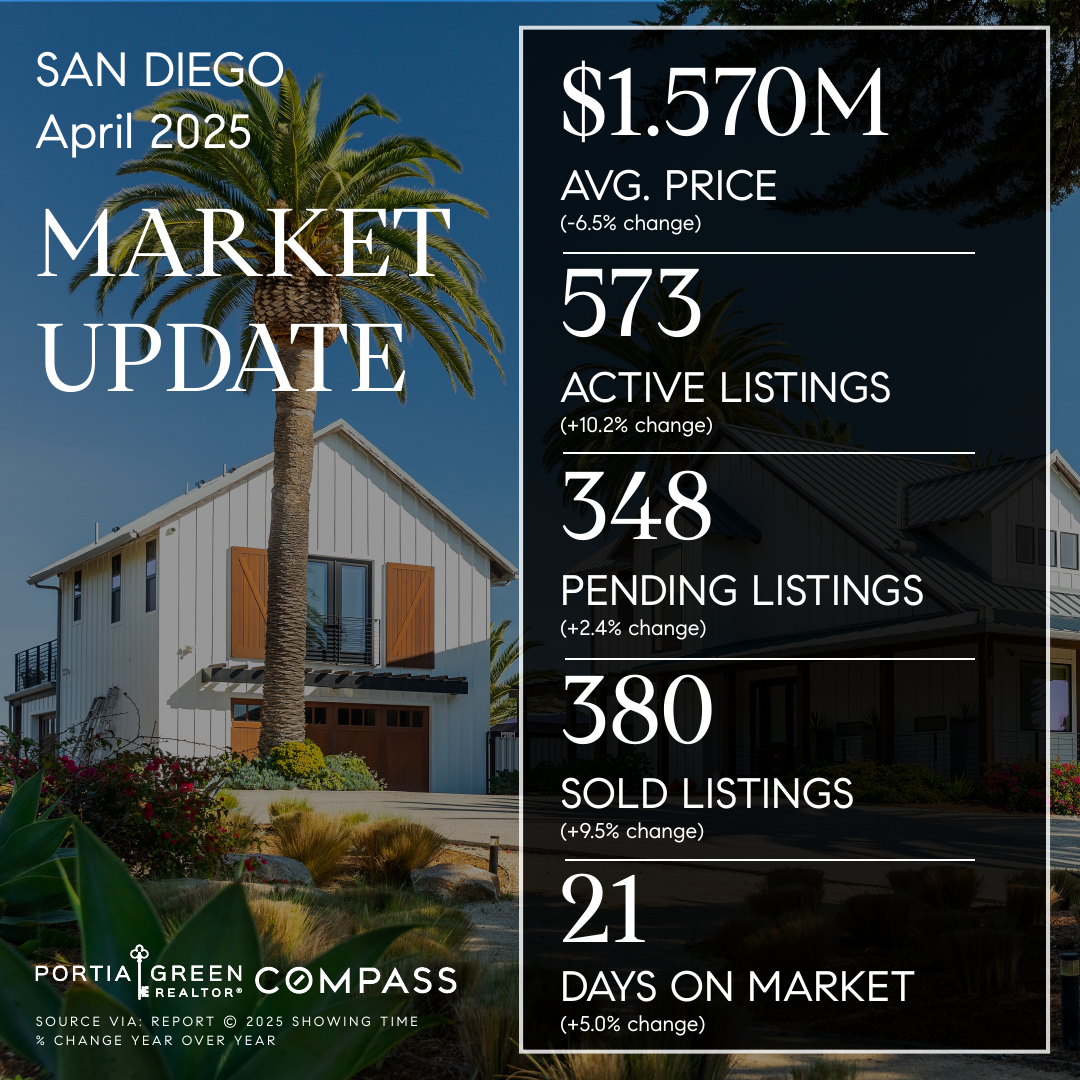
San Diego Housing Market Update — April 2025
• Sales Jump, Prices Cool • The San Diego housing market shifted…