• Supply Climbs, Demand Shifts •

The San Diego housing market shifted gears in August, with closed sales easing while new listings continued to climb.
San Diego home Buyers are navigating the late-summer real estate market cautiously, weighing fresh supply against steady pricing trends and ongoing interest rate sensitivity. Sellers, meanwhile, are adjusting expectations as more listings hit the market, knowing pricing power depends on how quickly Buyers step up.

Detached home sales fell 5.2 percent year-over-year in August 2025 compared to last year in August 2024. Attached home sales, including condos and townhomes, saw a steeper drop of 18.3 percent. Detached homes averaged 27 days on market, up 35.0 percent from 20 days on market last year, while attached homes averaged 37 days, up 27.3 percent from 29 days on market the year prior.

August 2025 San Diego Housing Market Update
San Diego home prices held relatively firm in August. The median sale price for detached homes rose 2.4 percent year-over-year to $1,075,000, underscoring consistent demand for standalone properties across the county.
Attached homes, like condos and townhomes, saw a marginal dip of 0.1 percent to a median of $675,000, reflecting a slower pace of sales and more variability in this segment.


Inventory gains continued to be a defining trend in August. Detached listings increased 8.4 percent compared to last year, while attached inventory surged 25.7 percent. This influx of homes available for sale in San Diego is giving Buyers more choice and added leverage, even as pricing trends remain largely steady and rate sensitivity continues to shape a balanced market.

San Diego Zip Codes with Most Homes Sold August 2025
In August, the top zip codes in San Diego County with the most home sales were:
• 92028 (Fallbrook) with 45
• 92064 (Poway) with 38
• 92071 (Santee) with 35
• 92057 (Oceanside North) with 33
• 92117 (Clairemont) with 32
These Inland San Diego zip codes remain sought-after for larger floorplans at competitive prices, offering a strong value per square foot compared to coastal neighborhoods. Many Buyers are prioritizing size, affordability, and quick freeway access over ocean views, keeping these Inland areas of San Diego consistently active.

Most Expensive House Sold in San Diego August 2025
The most expensive house sold last month during August 2025 in San Diego County was this iconic hilltop estate perched high on the bluff with sweeping whitewater ocean views in Del Mar Village. Fully remodeled in 2024, this warm coastal modern retreat was designed by KAA Design Group to capture 360-degree panoramic vistas, blending board-formed concrete, rich mahogany, and floor-to-ceiling glass for a dramatic yet inviting hillside sanctuary.
Set on a rare half-acre ridgetop lot, this 7,393 square foot estate features 5 bedrooms and 8 bathrooms, including a 3-bedroom “kid’s wing” suited for spacious living. The property also includes a detached 1-bedroom casita with kitchenette, a dedicated office, gym, playroom, and expansive indoor-outdoor entertaining spaces. The sprawling grounds showcase a vanishing-edge pool, spa, bocce and pickleball courts, a wood-fired pizza oven, outdoor bar, fire pit, and covered fireplace. A massive 2,795 square foot garage provides parking for up to 9 cars.
It sold on August 8th for $21,440,000. Listed by Ryan Gad of Heritage West Realty. MLS# 240028057.


San Diego Housing Market Real Estate Data
This snapshot of the latest San Diego real estate stats reflects activity and pricing from last month in August 2025, comparing key indicators year-over-year during August 2024. With supply trending upward and days on market extending, Buyers are regaining some leverage.
A growing inventory of homes available for sale is rebalancing San Diego home prices. Read on for a detailed analysis of this historical data and what impact these metrics have on Sellers, Buyers, and real estate trends around your neighborhood in San Diego.
Data on the current housing market in San Diego is compiled by the Greater San Diego Association of REALTORS® (SDAR) through the San Diego Multiple Listing Service (SDMLS).
Sources:
https://sdar.stats.10kresearch.com/docs/mmi/2025-08/x/report?src=page
https://nsdcar.stats.10kresearch.com/docs/lmu/x/SanDiegoCounty?src=map
https://media.sdar.com/media/CurrentStats.pdf

san diego housing market update, san diego real estate today, real estate news san diego, housing market decline san diego, real estate market bubble burst, san diego housing market crash, latest update on real estate market, san diego housing market article, current housing market update san diego, san diego real estate market explained, housing market forecast san diego, housing market correction san diego, housing market going up again, why is the housing market going up again, san diego housing market news, portia green realtor, reali housing market update san diego, redfin housing market updates san diego, zillow housing market updates san diego, realtor.com housing market update san diego, realtor near me san diego, how much does it cost to sell a house in san diego, how much does it cost to buy a house in san diego, san diego real estate data, san diego housing market, how to win a bidding war in san diego, opendoor housing market updates san diego, homes.com housing market updates san diego
About The Author

Related Posts

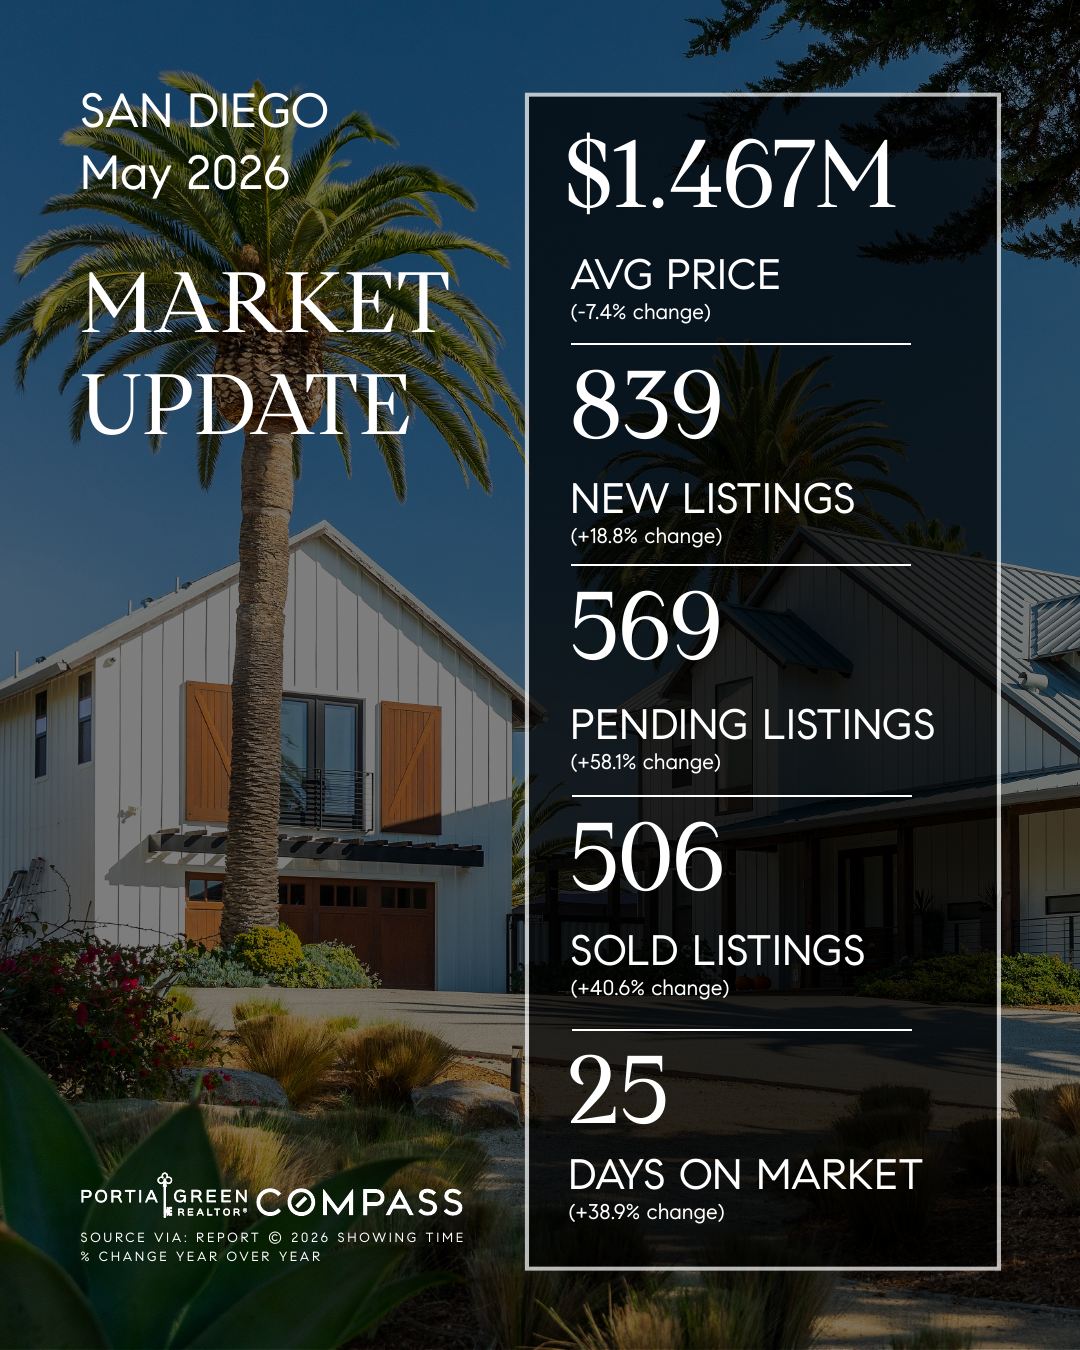
San Diego Housing Market Update — May 2026
• Contracts Surge, Inventory Splits • The San Diego housing market rallied…
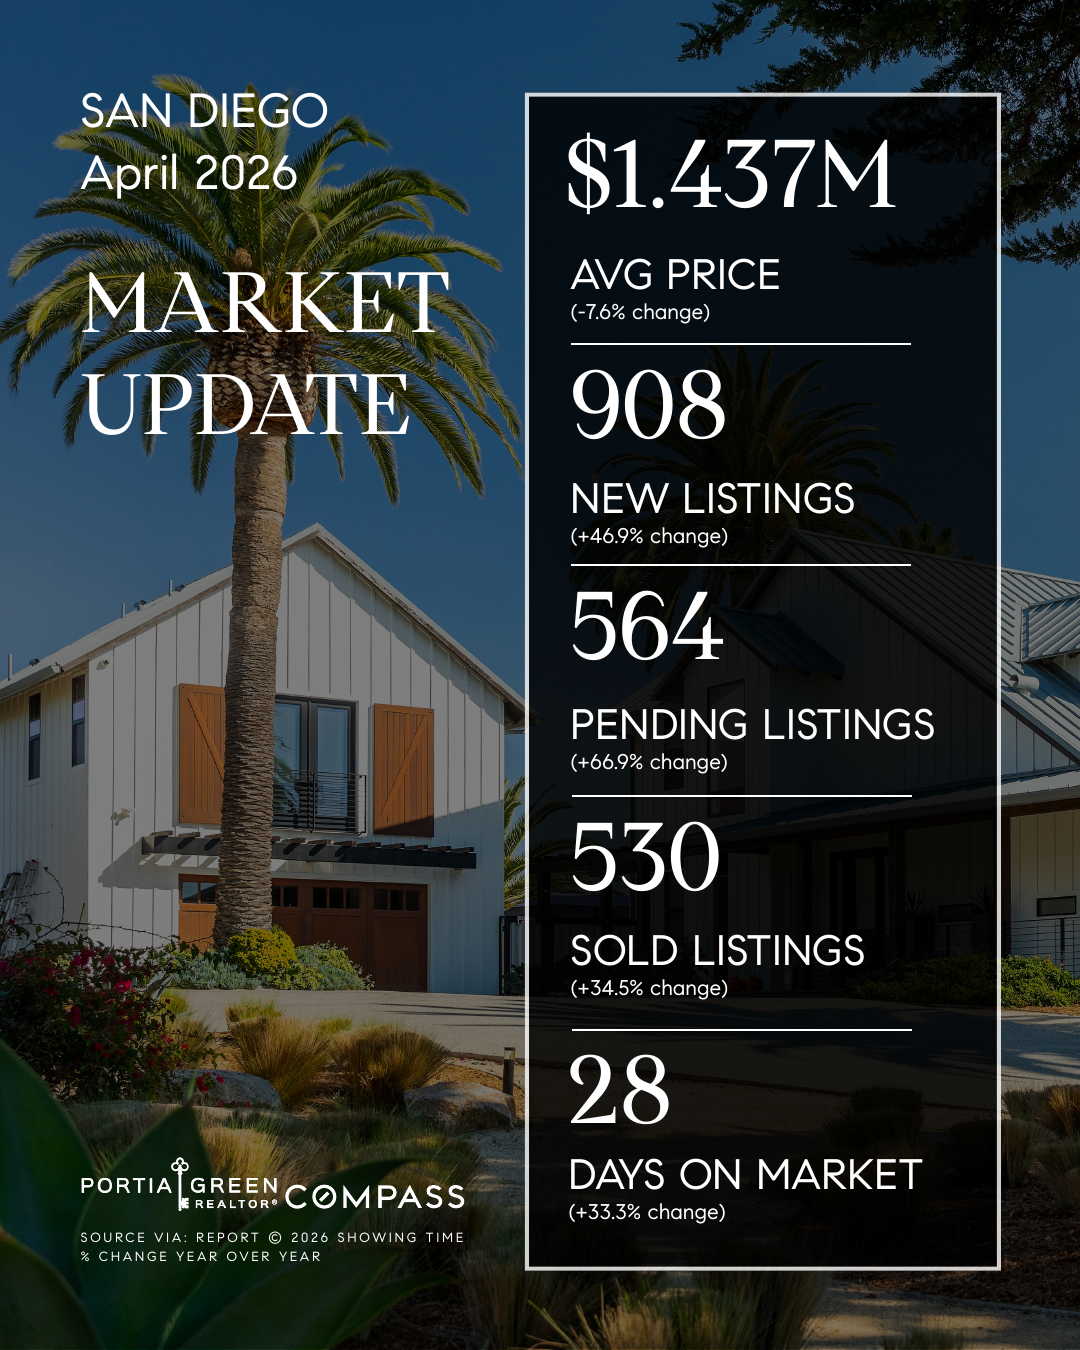
San Diego Housing Market Update — April 2026
• Pending Sales Rise, Supply Improves • Spring momentum carried further into…
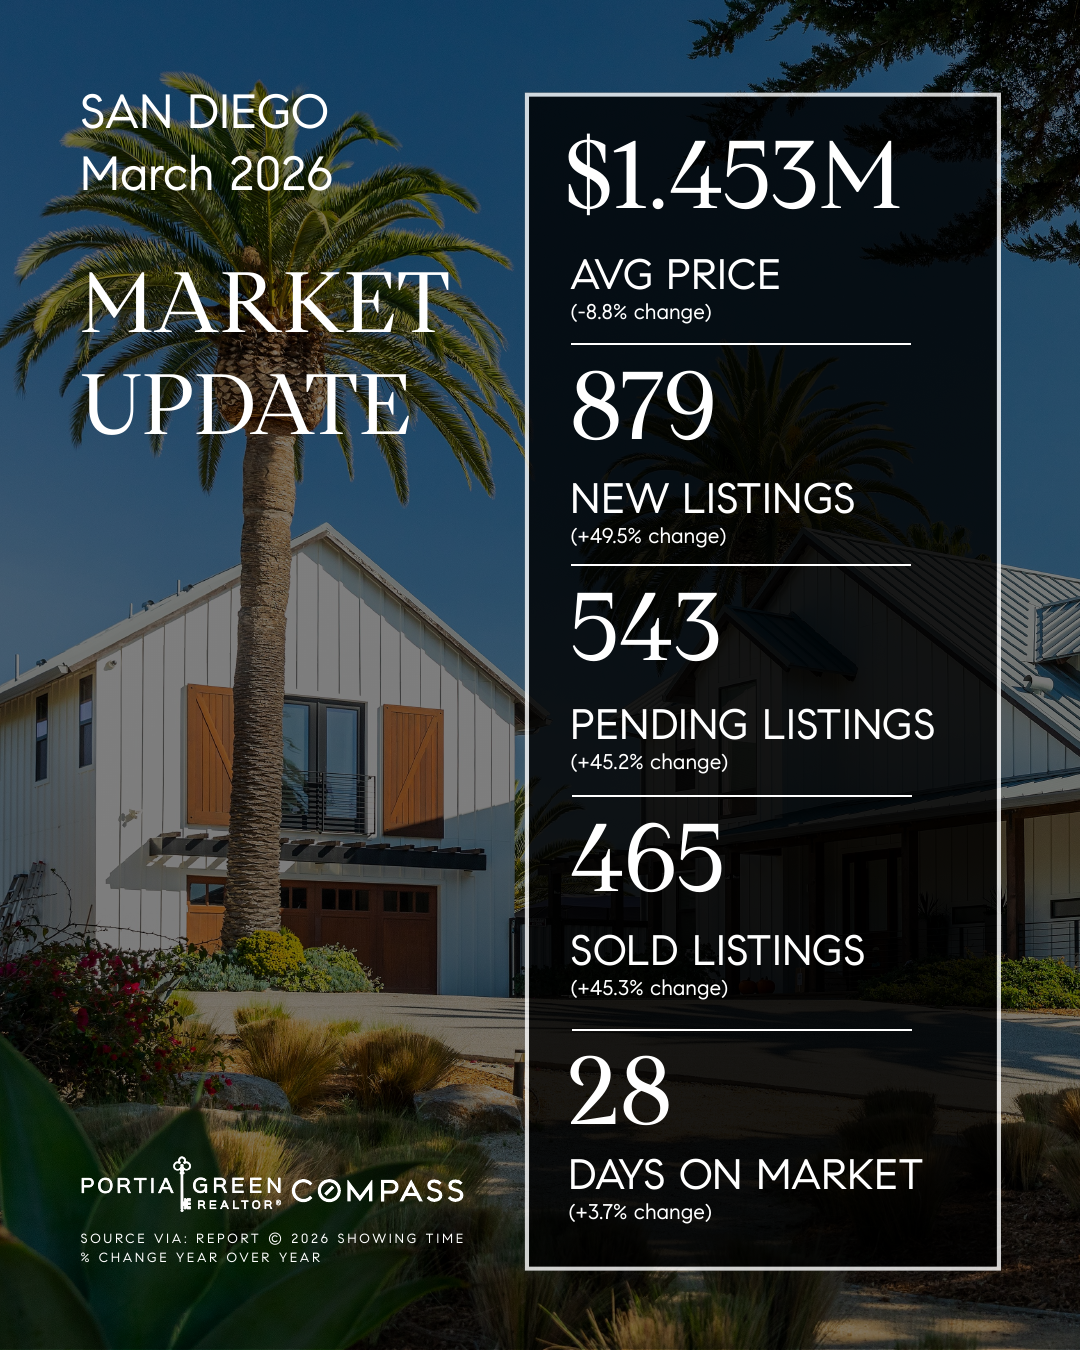
San Diego Housing Market Update — March 2026
• Supply Surges, Sales Climb • Momentum picked up across the San…