• Sales Jump, Prices Cool •
The San Diego housing market shifted this April, with modest gains in closed sales and a sizable jump in new listings. As more inventory hits the market, some Buyers are taking their time evaluating homes for sale, navigating interest rate volatility and shifting price trends with cautious optimism.
Detached home sales rose 6.3 percent year-over-year in April 2025 compared to April 2024. Attached home sales, including condos and townhomes, nudged up 0.7 percent from last year. Homes also sold at roughly the same pace as last year, with detached properties averaging 21 days on market, a 5 percent bump from 20 days on market one year ago.
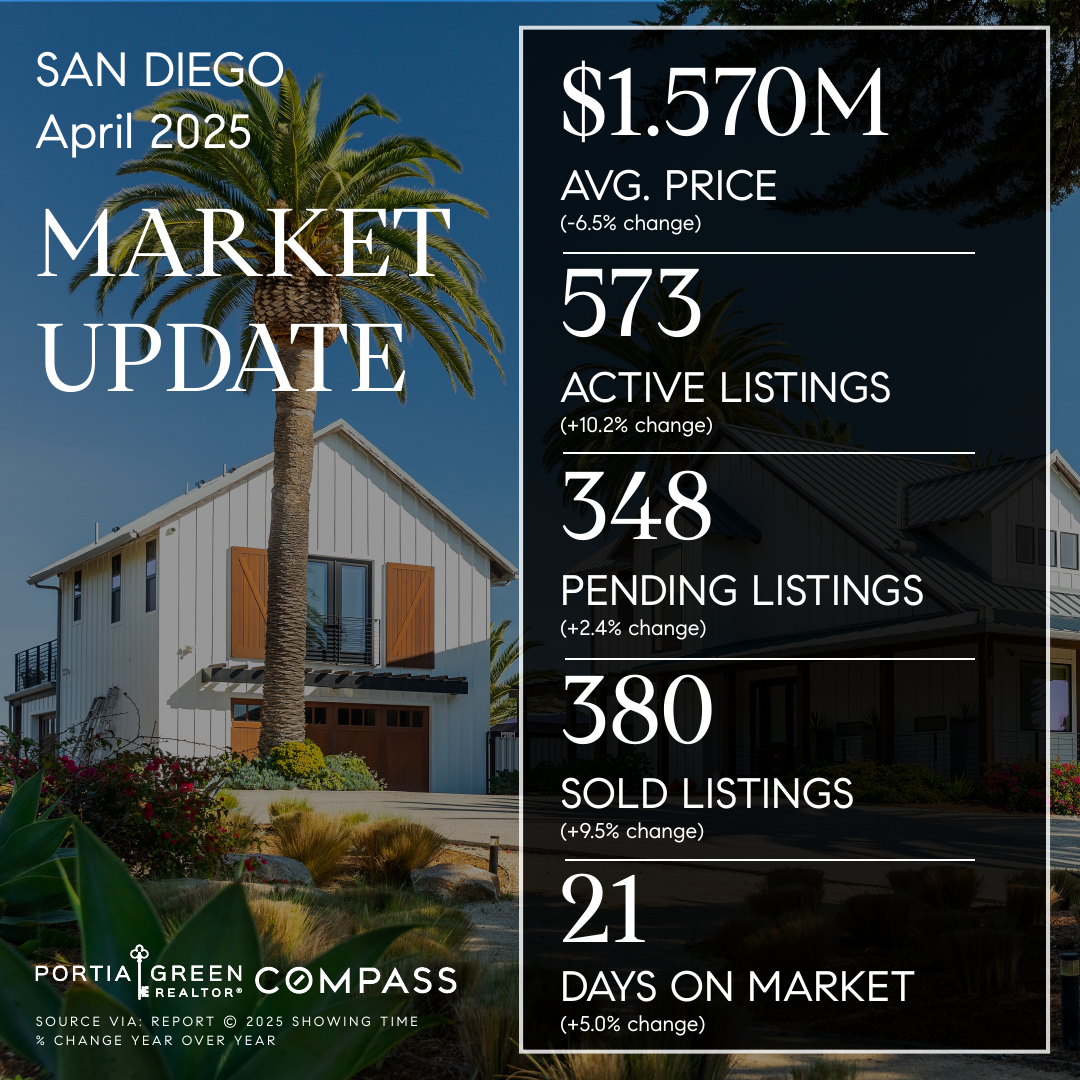
April 2025 San Diego Housing Market Update
San Diego home prices moved in the opposite direction of the sales climb in April, softening slightly compared to the same time last year. The median sale price for detached homes dipped 1.4 percent to $1,075,000. Attached homes, such as condos and townhomes, saw a 0.7 percent decline, bringing the median to $675,000.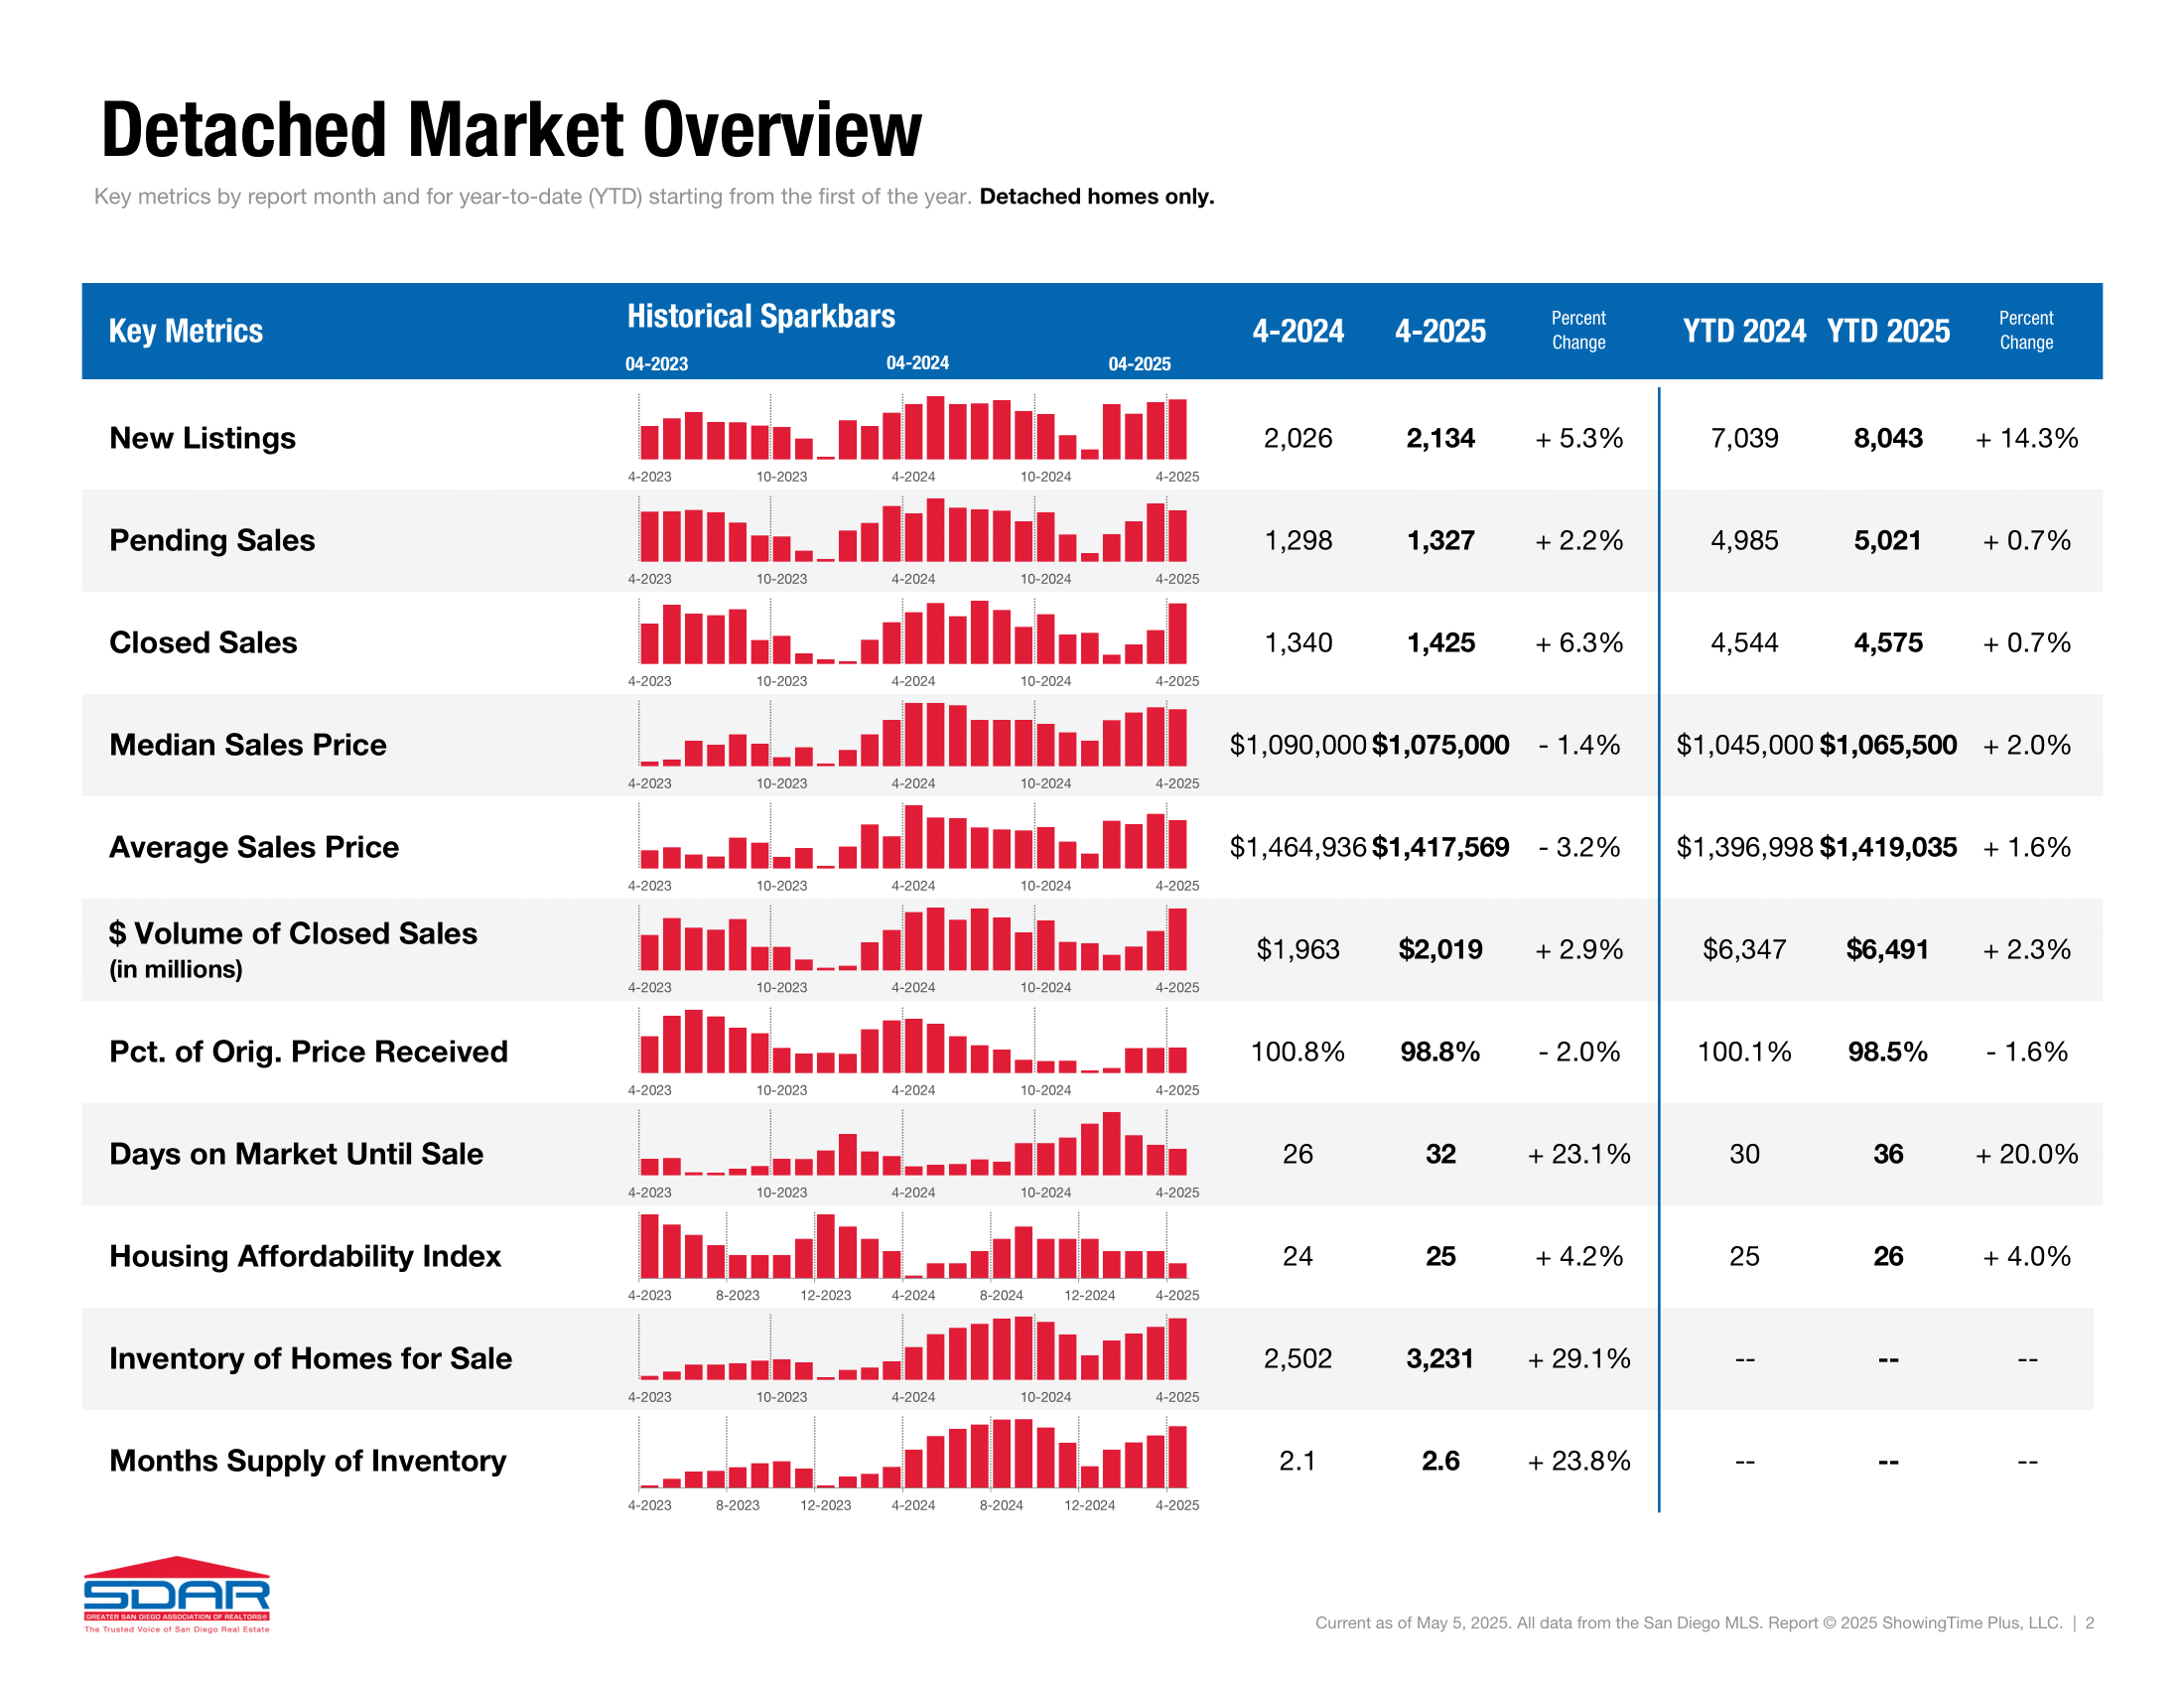
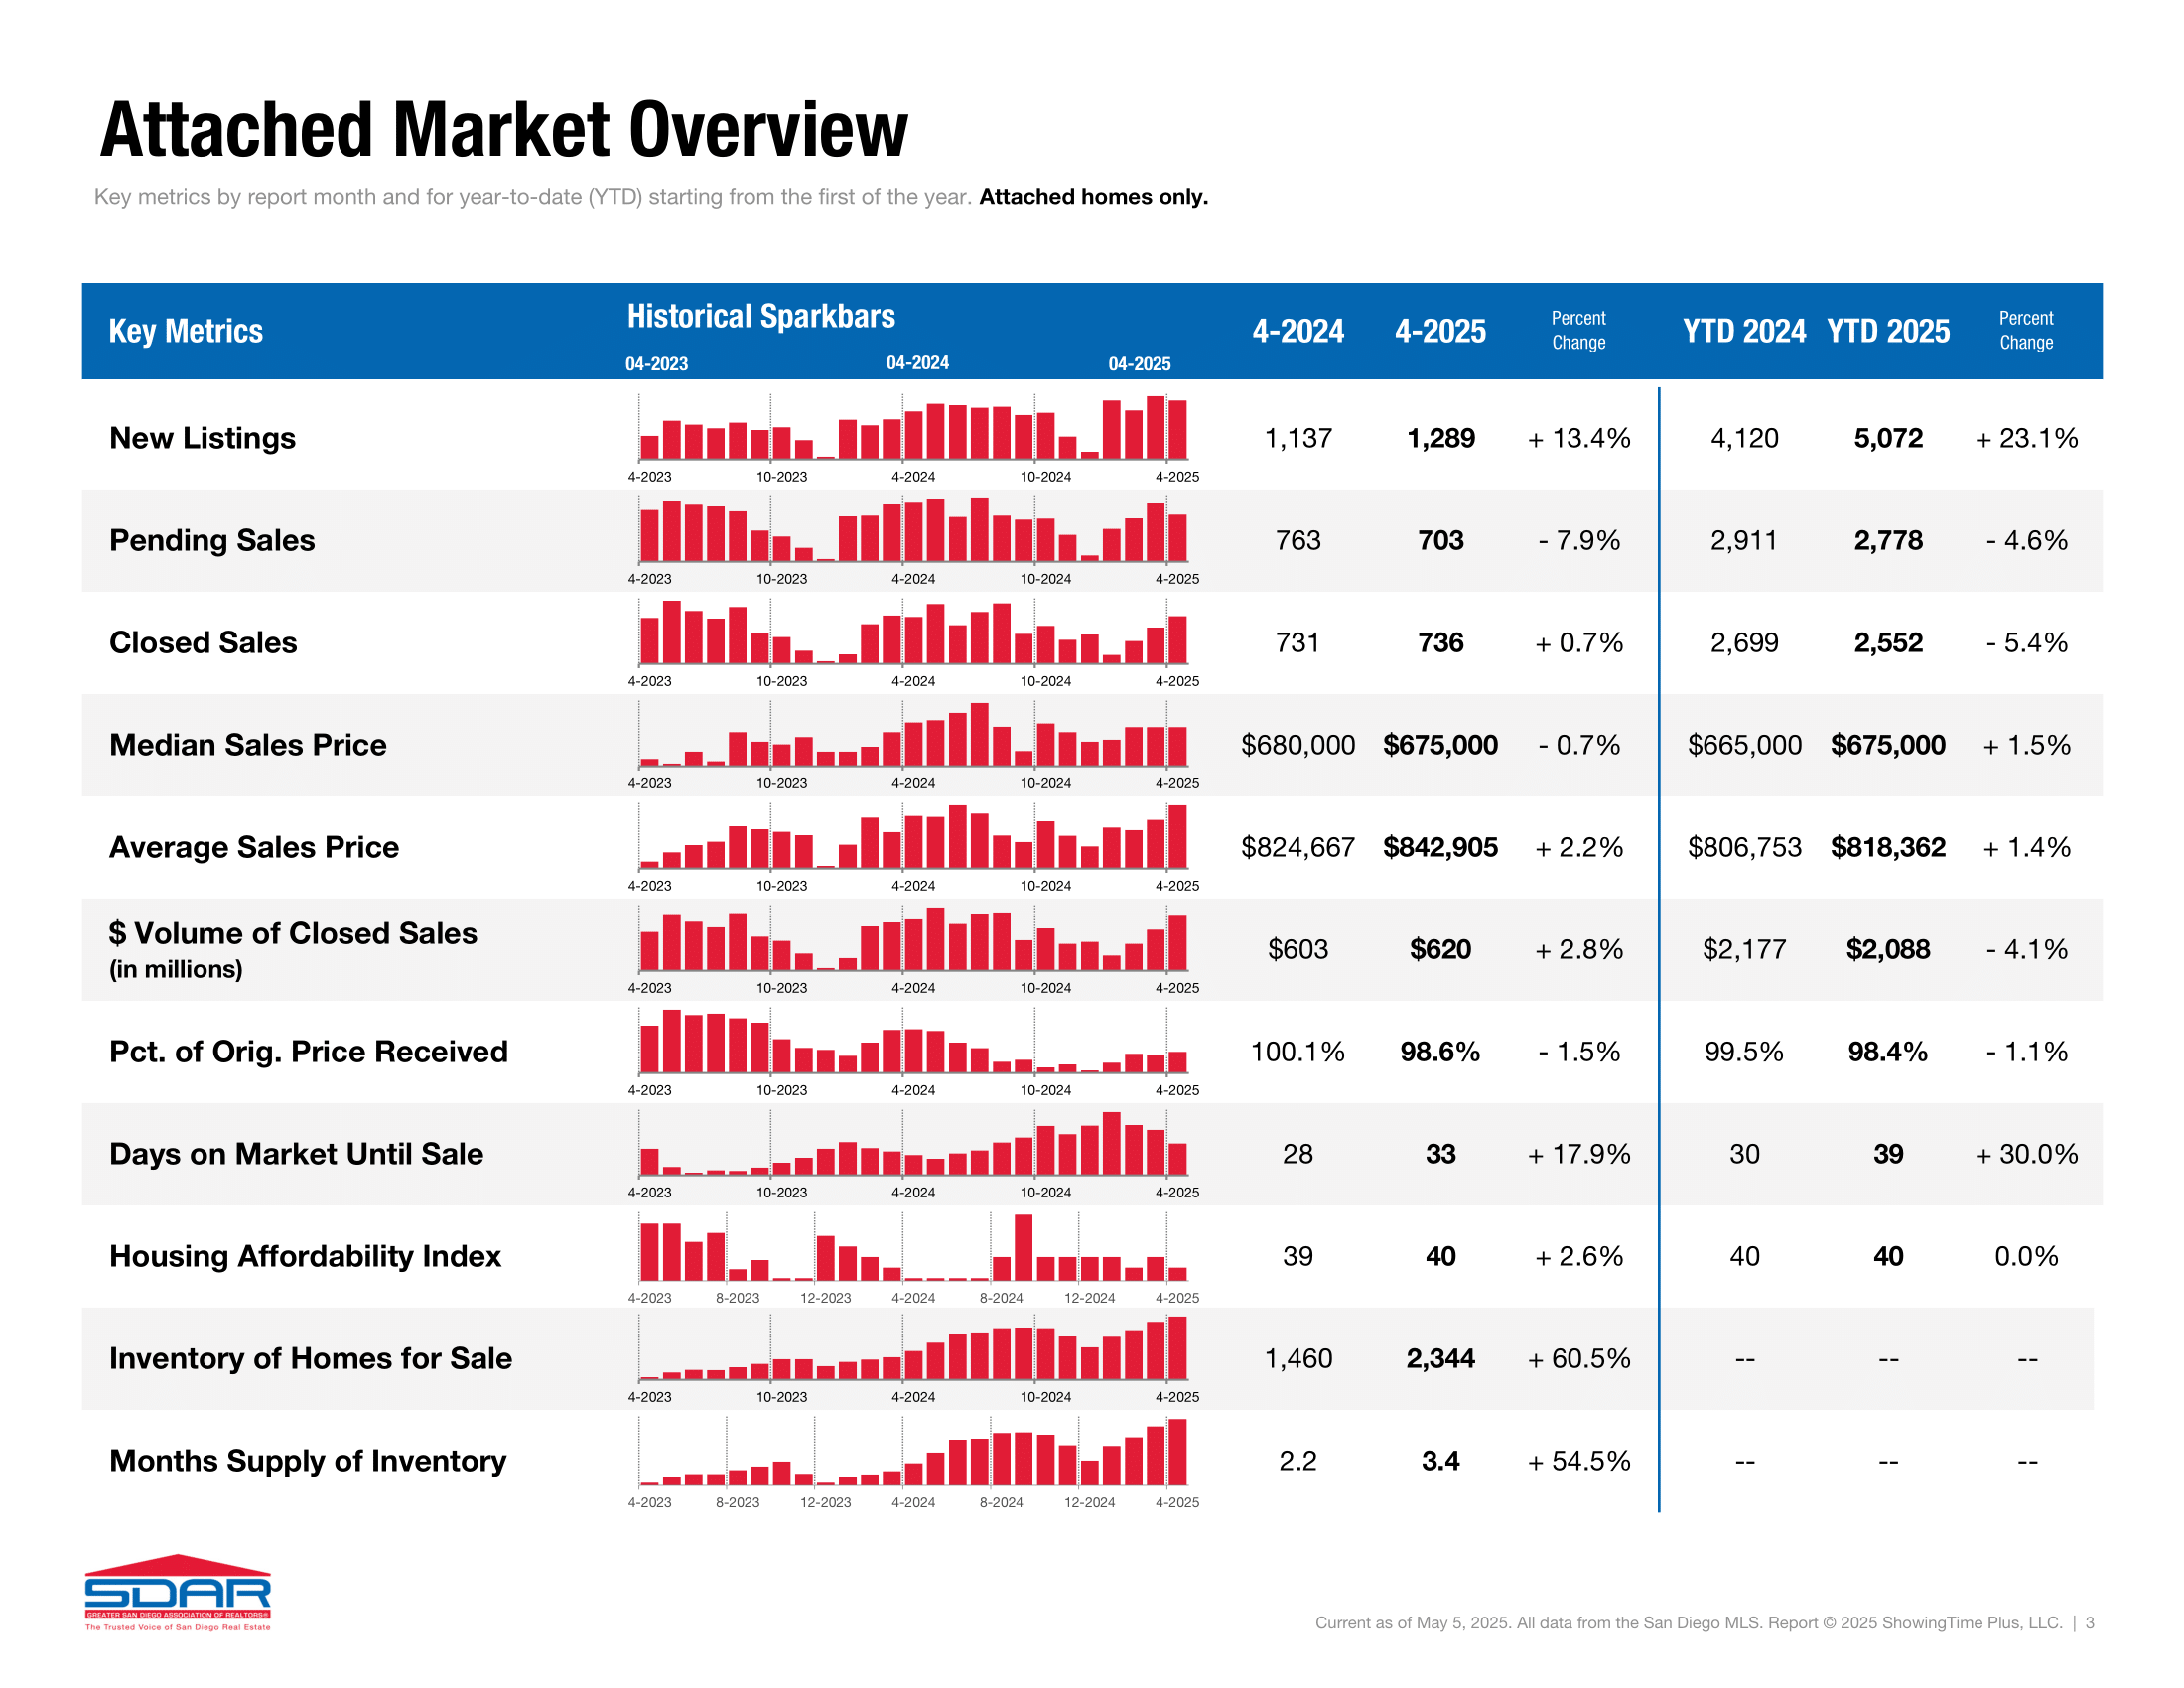
Housing inventory growth remained one of the most notable shifts in the market this spring. Detached home listings jumped 29.1 percent, while attached home inventory – including condos & townhomes – surged 60.5 percent from a year ago. This influx of new listings available for sale is giving some Buyers more leverage and time to weigh options, especially as navigating interest rate volatility and shifting price trends continue to influence decision-making.
San Diego Zip Codes with Most Homes Sold April 2025
The top zip codes for home sales in San Diego County during April were:
- 92028 (Fallbrook) with 50
- 92064 (Poway) with 39
- 92009 (Carlsbad Southeast) and 92057 (Oceanside North), both with 32
- 92058 (Oceanside East) and 92021 (El Cajon), both with 30
- 92026 (Escondido North) and 92040 (Lakeside), both with 26
These Inland San Diego neighborhoods remain popular with Buyers looking for more space and a lower price per square foot than coastal markets. This trend reflects growing interest in suburban homes East of the 5 that offer more affordable prices per square foot, paired with easy access to nearby amenities, without the coastal price tag.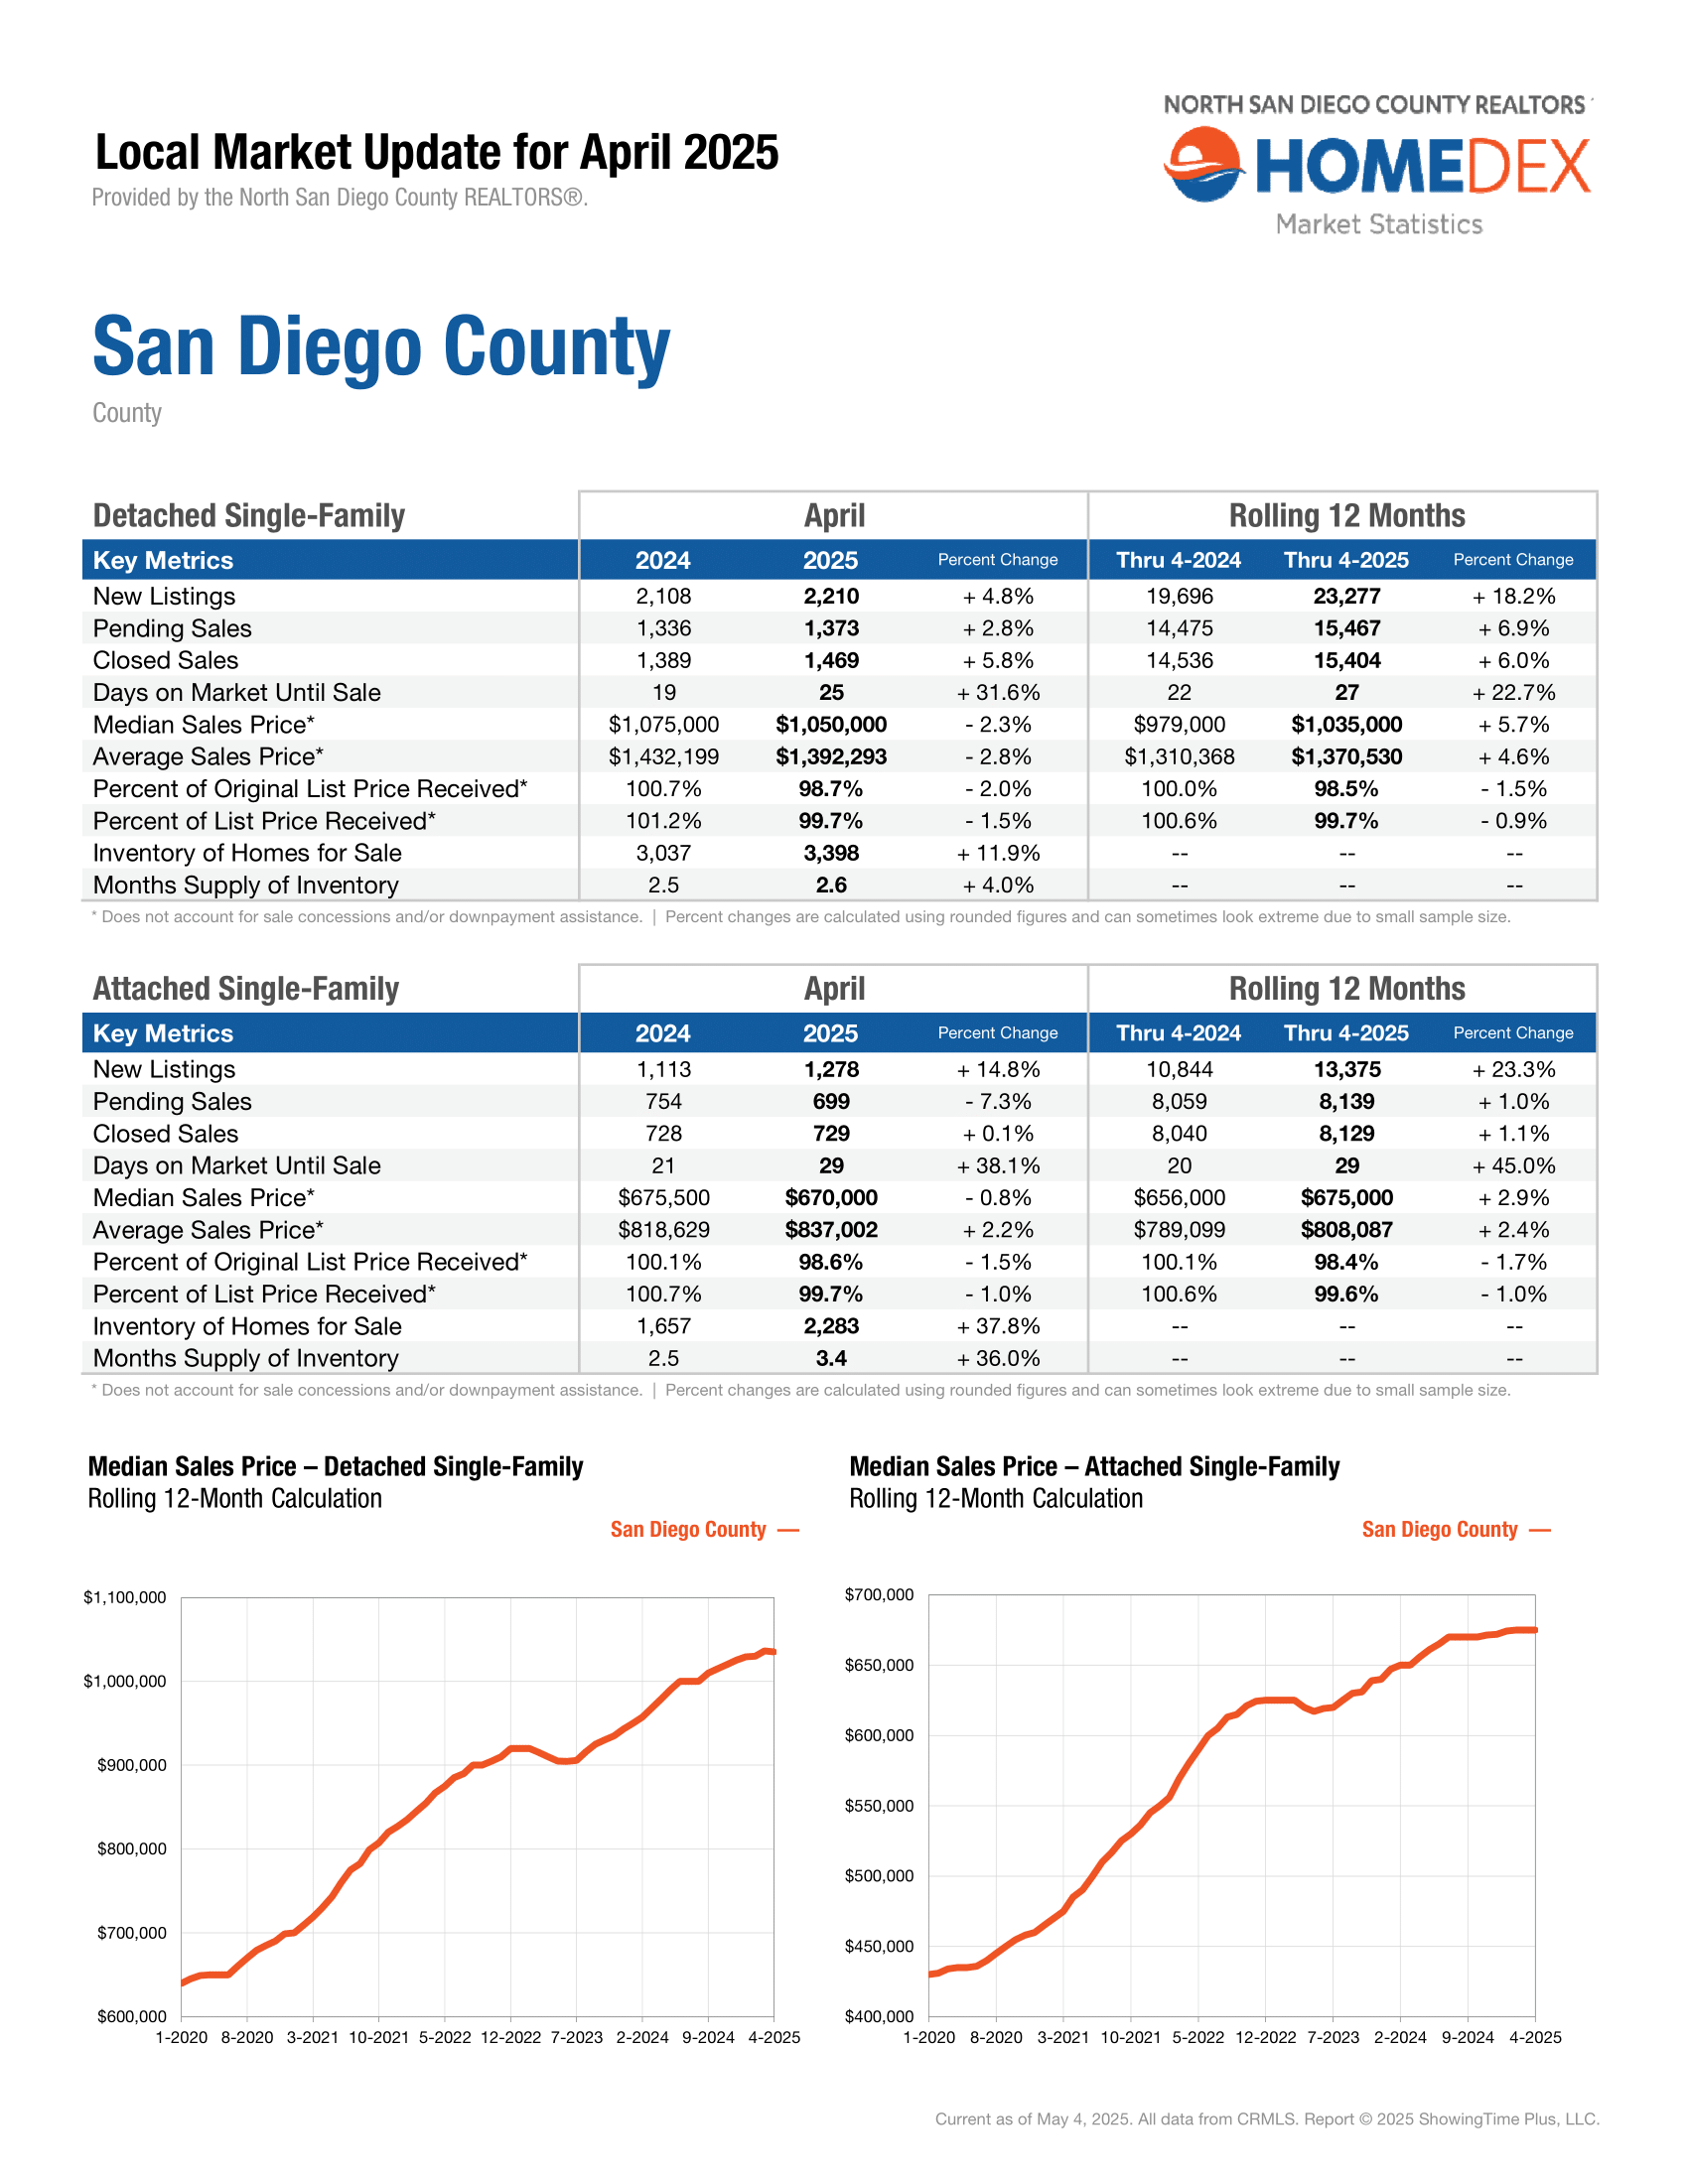
Most Expensive House Sold in San Diego April 2025
The most expensive house sold last month during April 2025 in San Diego County was a sleek standout oceanfront estate located along the coveted stretch of Camino de la Costa in the Lower Hermosa neighborhood of La Jolla. Close to Windansea Beach and the scenic coastline of Bird Rock, this striking architectural home blends raw concrete, teak, glass, and steel to create a modernist coastal retreat with rare character.
This notable property spans 5,674 square feet of serene oceanfront living. Perched above the bluff with expansive Pacific Ocean views and direct access to sandy shores below, the layout includes guest quarters with a private entrance, a library that includes a reading den, a home gym, and a custom 4-car lift system in the garage.
It sold on April 15, 2025 for $13,863,000. Listed by our colleague Bob Andrews at Compass. MLS# 240013807.


San Diego Housing Market Real Estate Data
This snapshot of the latest San Diego real estate stats from last month in April 2025 shows the percentage change year-over-year compared to April 2024. Growing inventory of homes available for sale is rebalancing San Diego home prices. Read on for a detailed analysis of this historical data and what impact these metrics have on Sellers, Buyers, and real estate trends around your neighborhood in San Diego.
Data on the current housing market in San Diego is compiled by the Greater San Diego Association of REALTORS® (SDAR) through the San Diego Multiple Listing Service (SDMLS).
Sources:
https://sdar.stats.10kresearch.com/docs/mmi/2025-04/x/report?src=page
https://nsdcar.stats.10kresearch.com/docs/lmu/x/SanDiegoCounty?src=map
https://media.sdar.com/media/CurrentStats.pdf

san diego housing market update, san diego real estate today, real estate news san diego, housing market decline san diego, real estate market bubble burst, san diego housing market crash, latest update on real estate market, san diego housing market article, current housing market update san diego, san diego real estate market explained, housing market forecast san diego, housing market correction san diego, housing market going up again, why is the housing market going up again, san diego housing market news, portia green realtor, reali housing market update san diego, redfin housing market updates san diego, zillow housing market updates san diego, realtor.com housing market update san diego, realtor near me san diego, how much does it cost to sell a house in san diego, how much does it cost to buy a house in san diego, san diego real estate data, san diego housing market, how to win a bidding war in san diego, opendoor housing market updates san diego, homes.com housing market updates san diego
About The Author

Related Posts

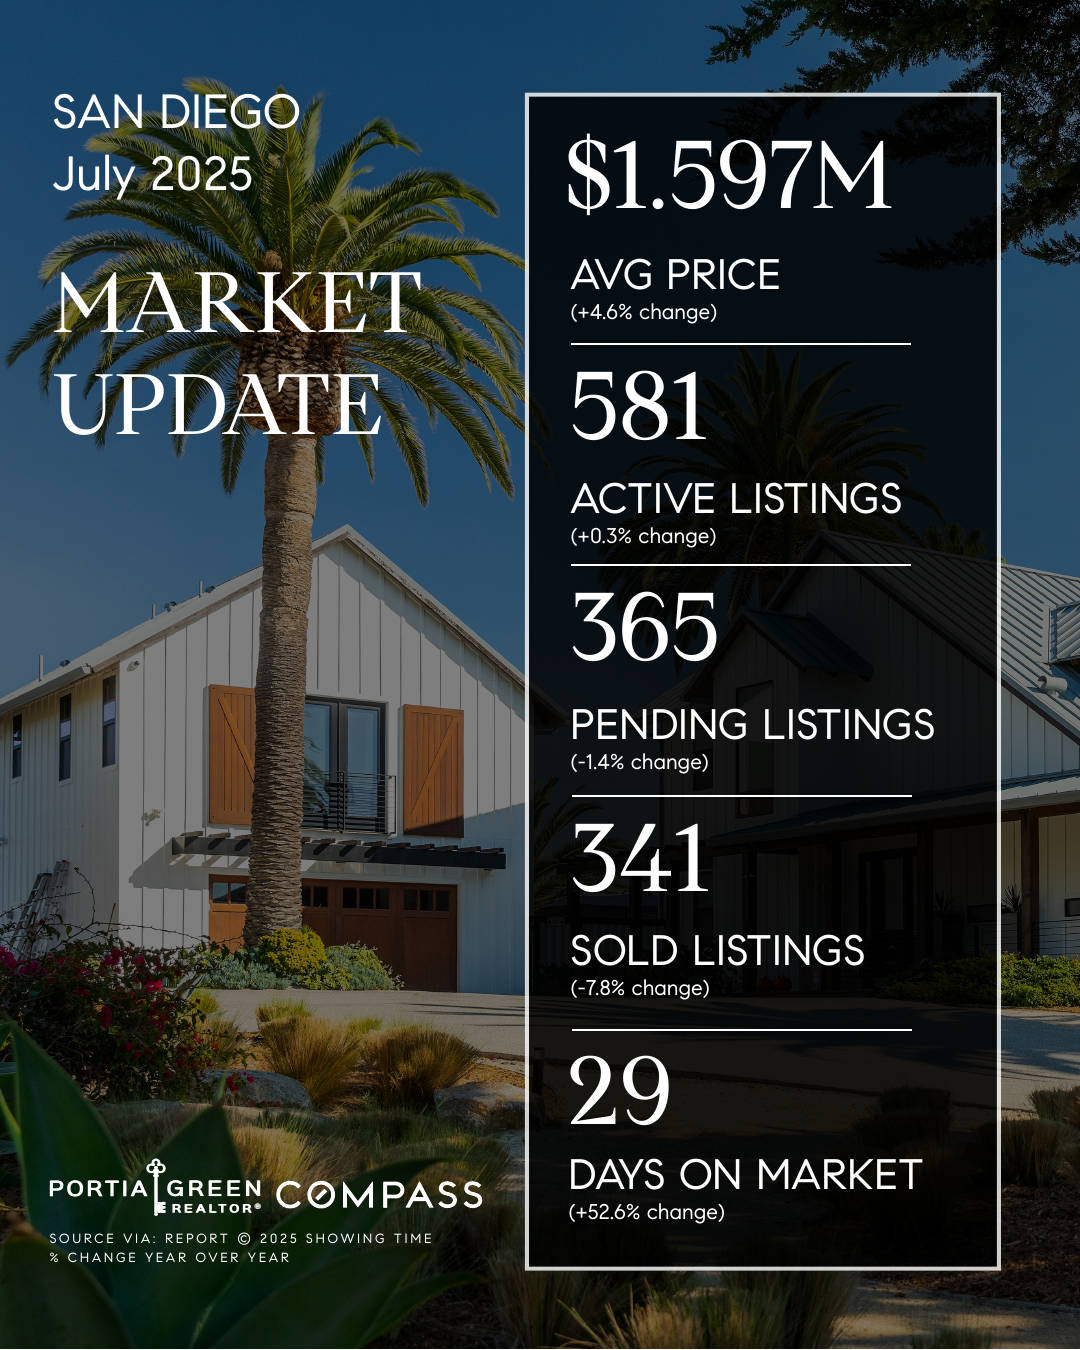
San Diego Housing Market Update — July 2025
• Inventory Builds, Sales Slow • The San Diego real estate market…
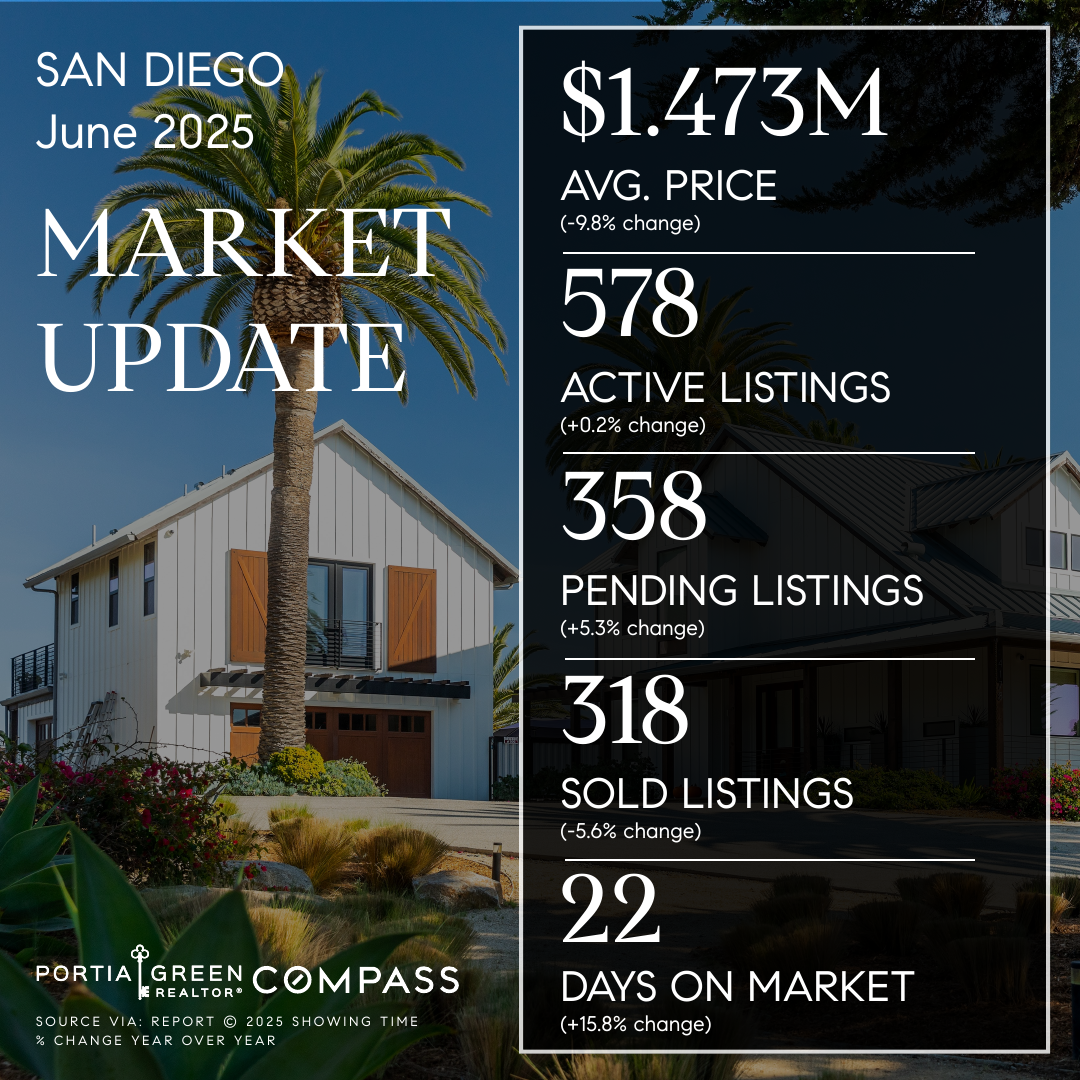
San Diego Housing Market Update — June 2025
• Inventory Grows, Demand Holds • The San Diego housing market continued…
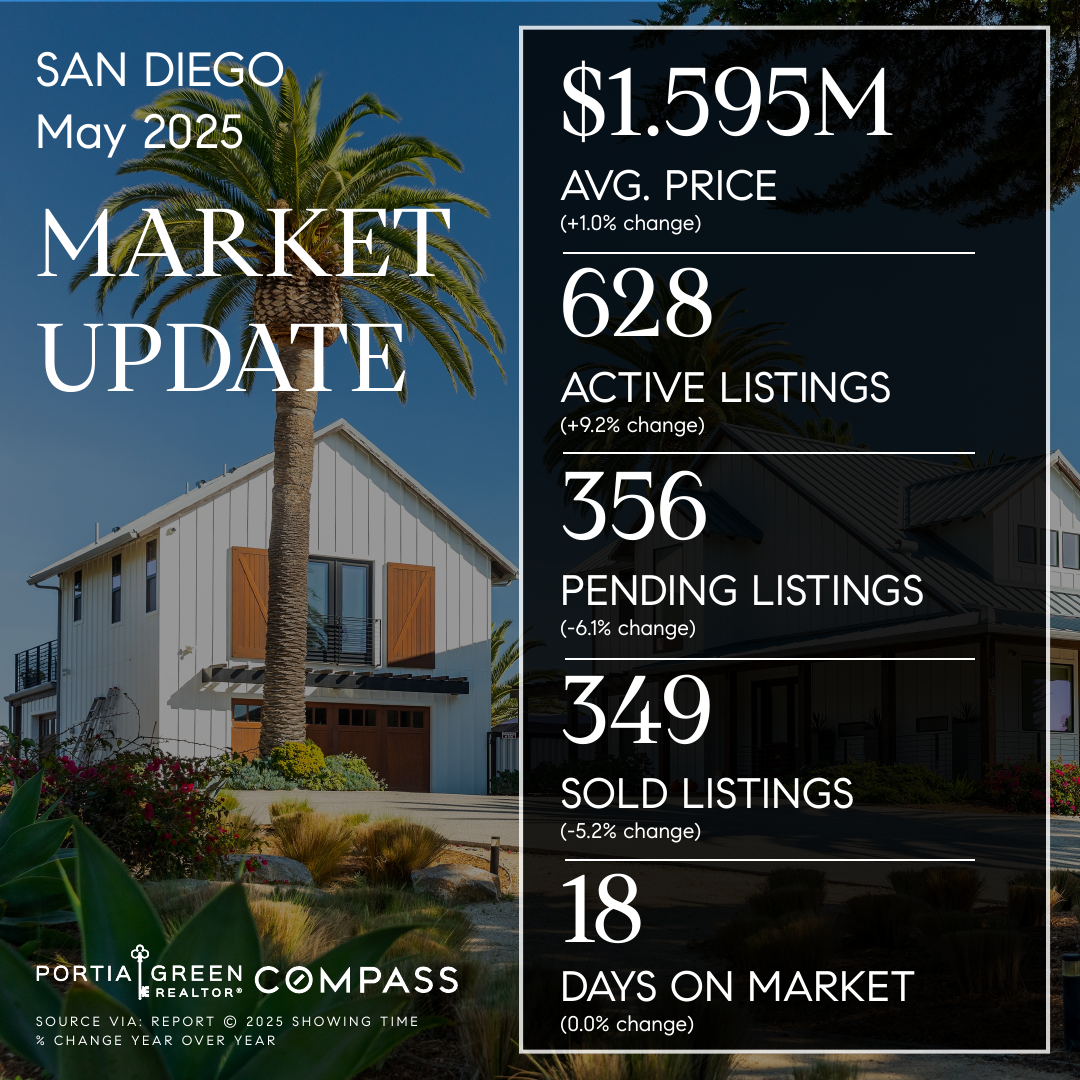
San Diego Housing Market Update — May 2025
• Listings Spike, Sales Dip • The San Diego housing market settled…