• Supply Surges, Sales Climb •

Momentum picked up across the San Diego housing market in March, with more homes closing and Buyers stepping back into the mix as Spring activity started to build. Home sale activity improved year-over-year across both detached homes and attached units, while sale price trends continued to move in opposite directions depending on property type.
Buyer demand showed more consistency heading into Spring, especially for prime properties that hit the market priced attractively based on similar recent sales. The shift showed up clearly in sales volume, even as housing inventory surged. 
Closed sales increased 5.2 percent year-over-year for detached homes in March 2026 compared to last year in March 2025. Attached properties, including condos and townhomes across San Diego, rose even more sharply at 9.7 percent. Homes are still taking slightly longer to sell, with days on market rising 8.8 percent for detached homes and 12.5 percent for condos & townhomes.
Pending sales continued to edge upward, signaling steady forward motion into the Spring market. New pending contracts increased 0.3 percent for detached homes and 3.0 percent for attached homes in March, reinforcing a growing pipeline of home sales activity as more Buyers re-engage this Spring.

March 2026 San Diego Housing Market Update
Home prices across San Diego held firm overall, though the split between property types remained clear. The median sale price for detached homes increased 2.4 percent year-over-year to $1,100,000, reflecting continued stability among detached homes.
Condos and townhomes moved slightly lower. The median price for attached homes declined 1.1 percent to $670,000, as increased inventory and broader selection gave Buyers more negotiating room.

Housing inventory trends diverged again in March. Detached home inventory dropped 21.5 percent year-over-year, tightening supply and supporting careful pricing in many neighborhoods. In contrast, attached inventory rose 3.2 percent, creating a more balanced environment across San Diego condo & townhome communities.
Months of supply followed a similar pattern. Detached homes saw a 23.1 percent decrease, while attached housing edged up 3.0 percent. These shifts continue to shape leverage at the neighborhood level, where pricing, condition, and timing all play a role in how homes are received. 
San Diego Zip Codes with Most Homes Sold March 2026
The top zip codes for home sales in San Diego County during March were:
- 92028 (Fallbrook) with 37
- 91977 (Spring Valley) with 36
- 92056 (Oceanside East) with 35
- 92026 (Escondido North) with 33
- 91913 (Chula Vista Eastlake) with 31
The top-performing zip codes for home sales in San Diego County during March echoed the ongoing demand for Inland neighborhoods, where larger lots and more space keep these markets active. These popular areas of Inland San Diego remain attractive to home Buyers looking for a more affordable price per square foot that goes further than coastal neighborhoods. 
Most Expensive House Sold in San Diego March 2026
The most expensive home sold last month during March 2026 in San Diego County was a striking oceanfront residence in La Jolla, set directly along the coastline with unobstructed ocean views stretching across panoramic windows. Floor-to-ceiling glass lines the main living areas, pulling in natural light and framing the seaside horizon from nearly every angle, while the layout flows seamlessly between indoor and outdoor living.
Designed for both privacy and presence, this 5-bedroom home features refined open-concept rooms, a custom chef’s kitchen, and a primary suite that opens to its own ocean-facing terrace. Outdoor spaces unfold across multiple levels, with landscaped gardens, lounge areas, and a relaxing spa set against a full panoramic backdrop of the water, creating a true coastal retreat.
It sold on March 9, 2026 for $14,500,000. Listed by our Compass colleague Craig Lotzof. MLS# 260005263.


San Diego Housing Market Real Estate Data
This snapshot of the latest San Diego real estate stats reflects activity and pricing from last month in March 2026, comparing key indicators year-over-year during March 2025. With inventory trends shifting by property type and days on market extending, Buyers are regaining some leverage.
The evolving inventory of homes available for sale is rebalancing San Diego home prices. Read on for a detailed analysis of this historical data and what impact these metrics have on Sellers, Buyers, and real estate trends around your neighborhood in San Diego.
Data on the current housing market in San Diego is compiled by the Greater San Diego Association of REALTORS® (SDAR) through the San Diego Multiple Listing Service (SDMLS).
Sources:
https://sdar.stats.10kresearch.com/docs/mmi/2026-03/x/report?src=page
https://nsdcar.stats.10kresearch.com/docs/lmu/x/SanDiegoCounty?src=map
https://media.sdar.com/media/CurrentStats.pdf

san diego housing market update, san diego real estate today, real estate news san diego, housing market decline san diego, real estate market bubble burst, san diego housing market crash, latest update on real estate market, san diego housing market article, current housing market update san diego, san diego real estate market explained, housing market forecast san diego, housing market correction san diego, housing market going up again, why is the housing market going up again, san diego housing market news, portia green realtor, reali housing market update san diego, redfin housing market updates san diego, zillow housing market updates san diego, realtor.com housing market update san diego, realtor near me san diego, how much does it cost to sell a house in san diego, how much does it cost to buy a house in san diego, san diego real estate data, san diego housing market, how to win a bidding war in san diego, opendoor housing market updates san diego, homes.com housing market updates san diego
About The Author

Related Posts

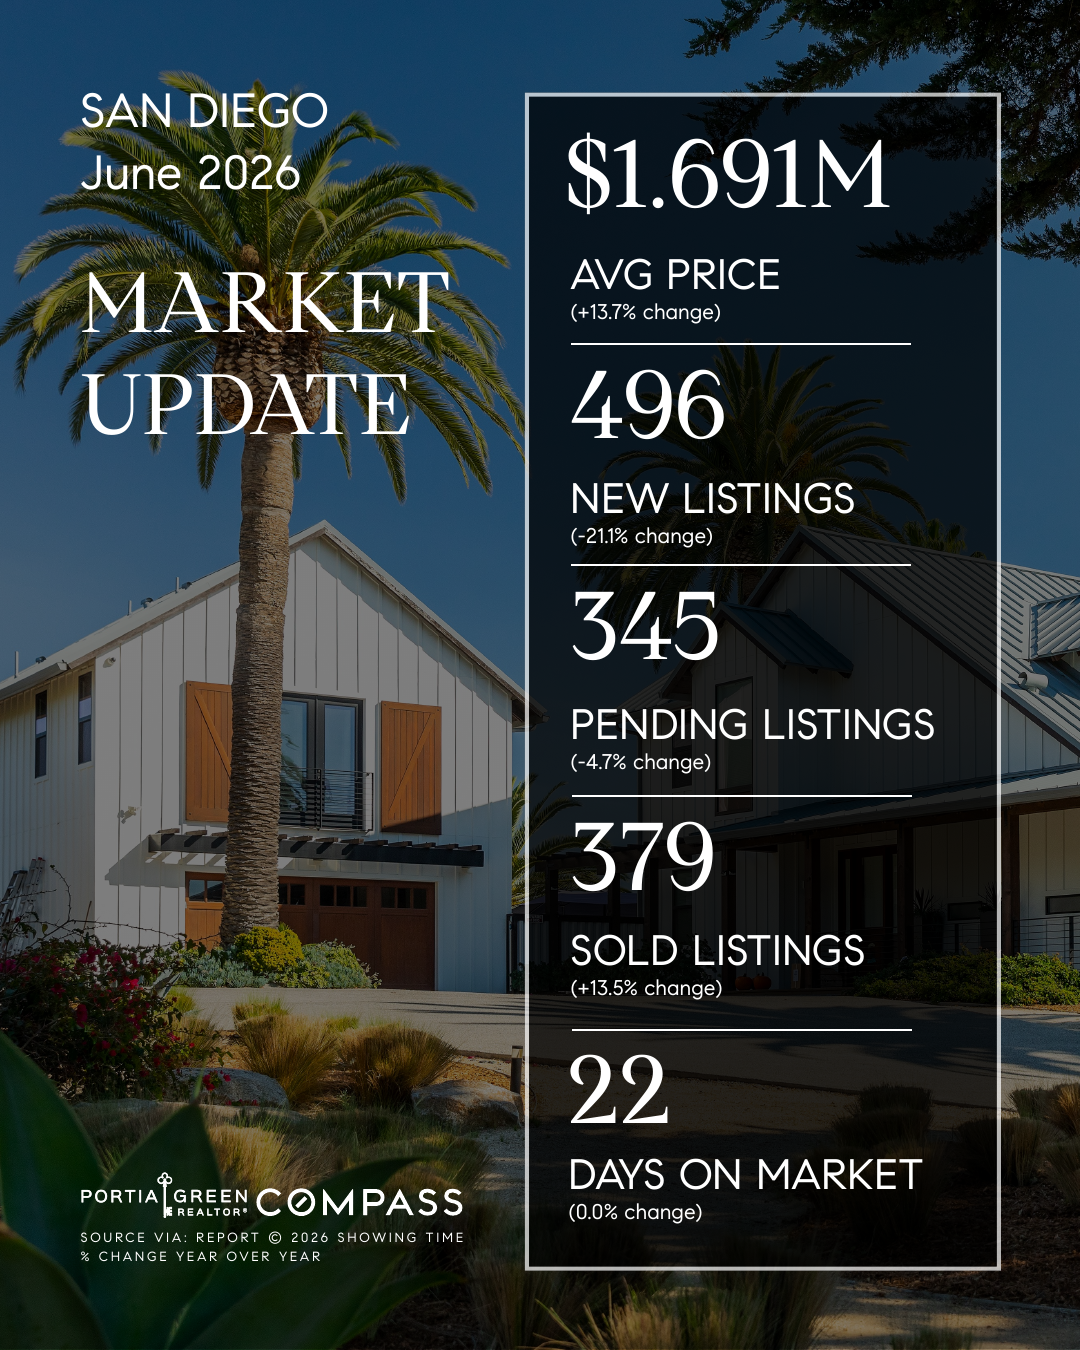
San Diego Housing Market Update — June 2026
• Sales Jump, Supply Remains Split • The San Diego housing market…
San Diego Housing Market Update — May 2026
• Contracts Surge, Inventory Splits • The San Diego housing market rallied…
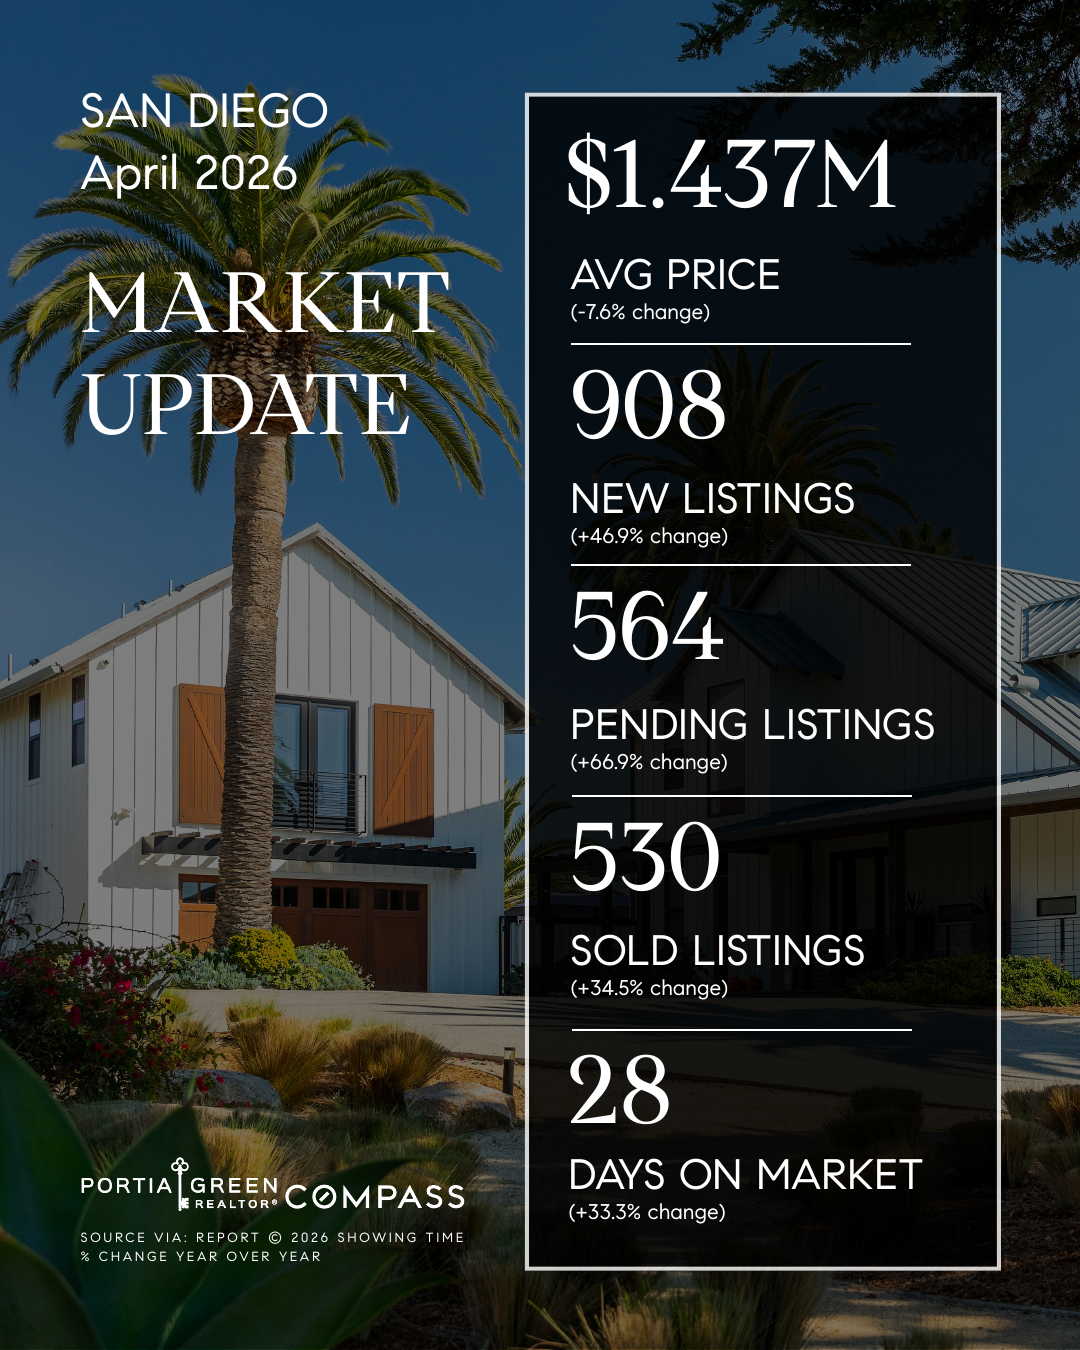
San Diego Housing Market Update — April 2026
• Pending Sales Rise, Supply Improves • Spring momentum carried further into…