• Supply Holds, Demand Lifts •

The San Diego housing market steadied in September, with home sales holding firm while housing inventory levels remained elevated.
San Diego home Buyers showed fresh momentum as more homes moved under contract, even as interest rates continue to fluctuate. Sellers are tracking this shift closely, knowing that price and presentation still drive results.

Detached home sales rose 5.1 percent year-over-year in September 2025 compared to last year in September 2024. Attached home sales, including condos and townhomes, increased 8.1 percent over the same period. Homes continued to take longer to sell, with detached properties averaging 20.6 percent longer days on market year-over-year and attached homes up 19.4 percent.

September 2025 San Diego Housing Market Update
San Diego home prices moved in opposite directions across property types in September. The median sale price for detached homes declined 2.8 percent year-over-year to $1,020,500, reflecting added inventory and longer marketing times for detached properties.
Attached homes, including condos and townhomes, saw prices move higher, with the median rising 3.2 percent to $671,500, supported by steady demand at lower price points.


Growing inventory continued to shape the fall market. Detached home listings increased 19.2 percent compared to last year, while attached inventory climbed 45.2 percent year-over-year. This expanded supply gives Buyers more room to evaluate options and negotiate, while Sellers are adjusting price strategies as days on market stretch and competition increases across many neighborhoods.

San Diego Zip Codes with Most Homes Sold September 2025
In September, the zip codes in San Diego County with the most home sales were:
• 92028 (Fallbrook) with 38
• 91977 (Spring Valley) with 32
• 92057 (Oceanside North) with 31
• 92071 (Santee) with 30
• 92065 (Ramona) with 29
These Inland San Diego areas continue to attract Buyers seeking more space and value per square foot compared to coastal neighborhoods. Accessibility and pricing flexibility remain key drivers of activity in these markets.

Most Expensive House Sold in San Diego September 2025
The most expensive house sold last month during September 2025 in San Diego County was a record-setting blufftop oceanfront estate along Camino de la Costa in La Jolla. Perched on one of the highest coastal ridgelines in San Diego, the home captures wraparound whitewater ocean views with mountain views in the distance. Recently reimagined, the property pairs a warm coastal modern aesthetic with an oceanfront setting that puts the Pacific coastline front and center.
Spanning over 13,000 square feet, this estate includes 4 bedrooms and 9 bathrooms, along with a private office, den, gym, and a detached guest casita with its own entrance. The finishes lean bold and functional, with board-formed concrete, stained mahogany, and floor-to-ceiling glass that anchors the architecture. Layered outdoor living rounds out the resort-scale amenities that include a vanishing-edge pool & spa, bocce and pickleball courts, and multiple ocean-view terraces.
It sold on September 12, 2025 for $47,000,000, marking one of the highest residential sales ever recorded in San Diego County. Listed by our Compass colleagues Ross Clark & Brett Dickinson. MLS# 250038783.


San Diego Housing Market Real Estate Data
This snapshot of the latest San Diego real estate stats reflects activity and pricing from last month in September 2025, comparing key indicators year-over-year during September 2024. With supply trending upward and days on market extending, Buyers are regaining some leverage.
A growing inventory of homes available for sale is rebalancing San Diego home prices. Read on for a detailed analysis of this historical data and what impact these metrics have on Sellers, Buyers, and real estate trends around your neighborhood in San Diego.
Data on the current housing market in San Diego is compiled by the Greater San Diego Association of REALTORS® (SDAR) through the San Diego Multiple Listing Service (SDMLS).
Sources:
https://sdar.stats.10kresearch.com/docs/mmi/2025-09/x/report?src=page
https://nsdcar.stats.10kresearch.com/docs/lmu/x/SanDiegoCounty?src=map
https://media.sdar.com/media/CurrentStats.pdf

san diego housing market update, san diego real estate today, real estate news san diego, housing market decline san diego, real estate market bubble burst, san diego housing market crash, latest update on real estate market, san diego housing market article, current housing market update san diego, san diego real estate market explained, housing market forecast san diego, housing market correction san diego, housing market going up again, why is the housing market going up again, san diego housing market news, portia green realtor, reali housing market update san diego, redfin housing market updates san diego, zillow housing market updates san diego, realtor.com housing market update san diego, realtor near me san diego, how much does it cost to sell a house in san diego, how much does it cost to buy a house in san diego, san diego real estate data, san diego housing market, how to win a bidding war in san diego, opendoor housing market updates san diego, homes.com housing market updates san diego
About The Author

Related Posts

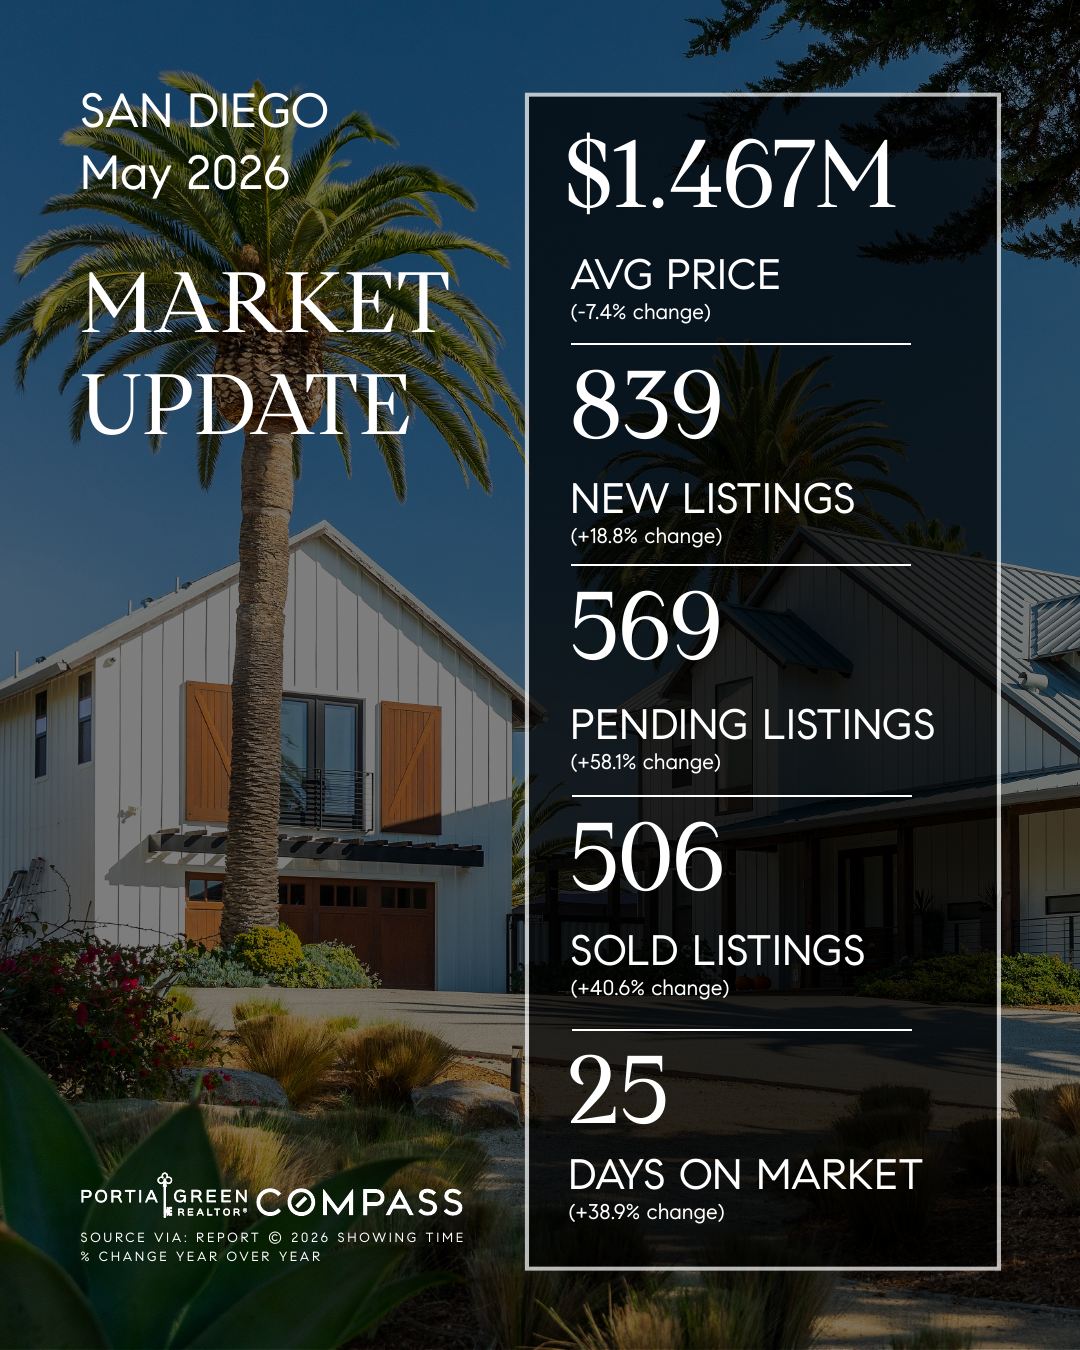
San Diego Housing Market Update — May 2026
• Contracts Surge, Inventory Splits • The San Diego housing market rallied…
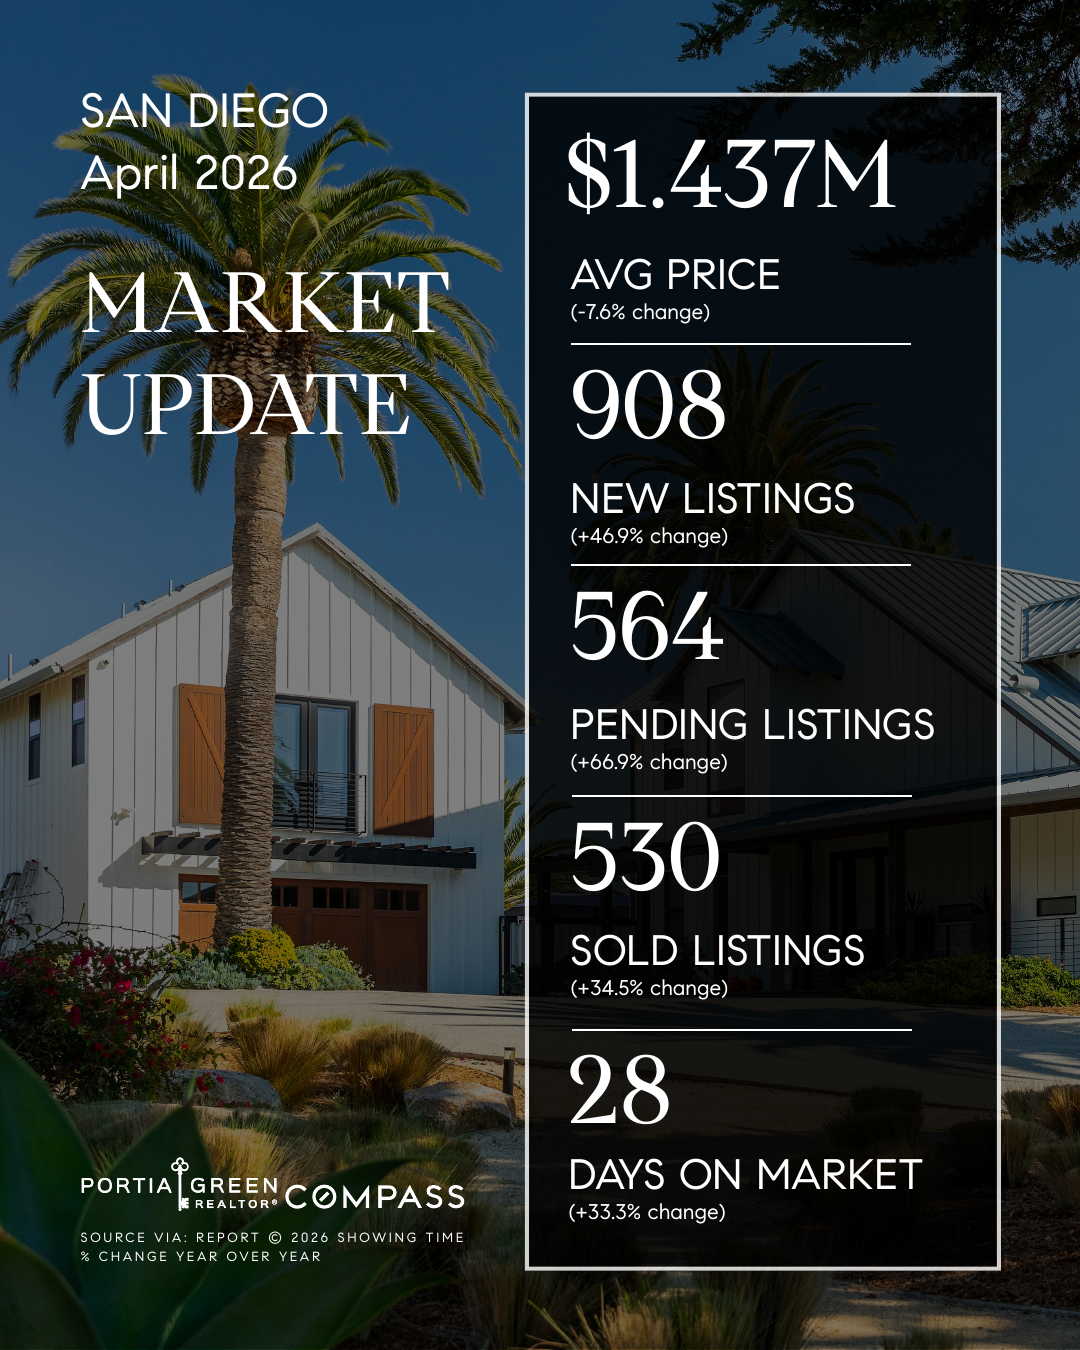
San Diego Housing Market Update — April 2026
• Pending Sales Rise, Supply Improves • Spring momentum carried further into…
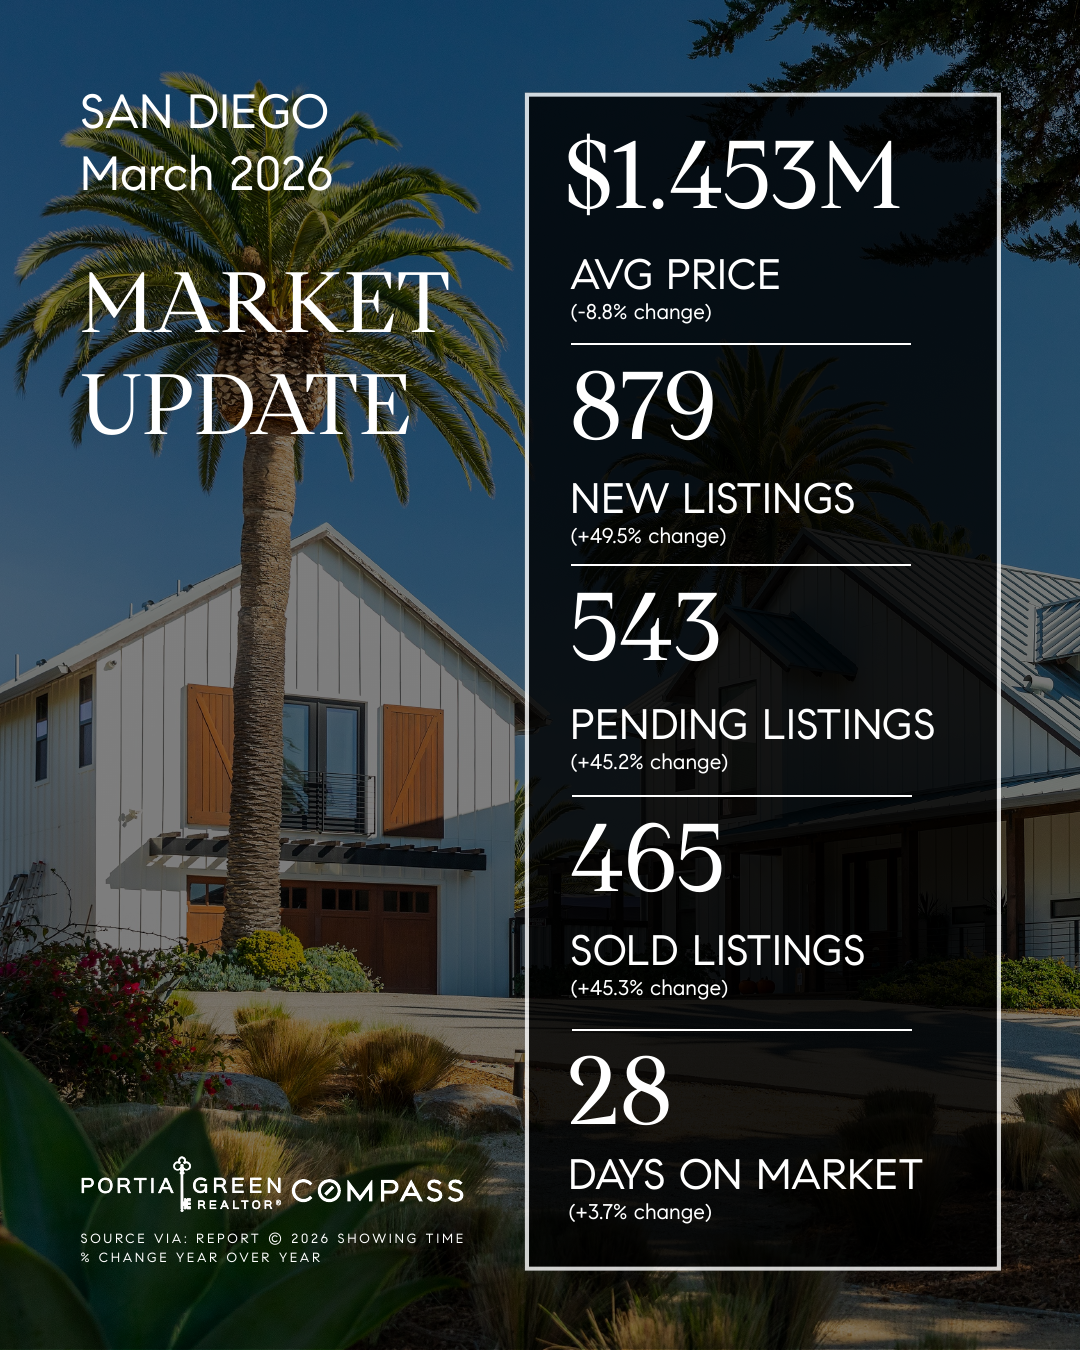
San Diego Housing Market Update — March 2026
• Supply Surges, Sales Climb • Momentum picked up across the San…