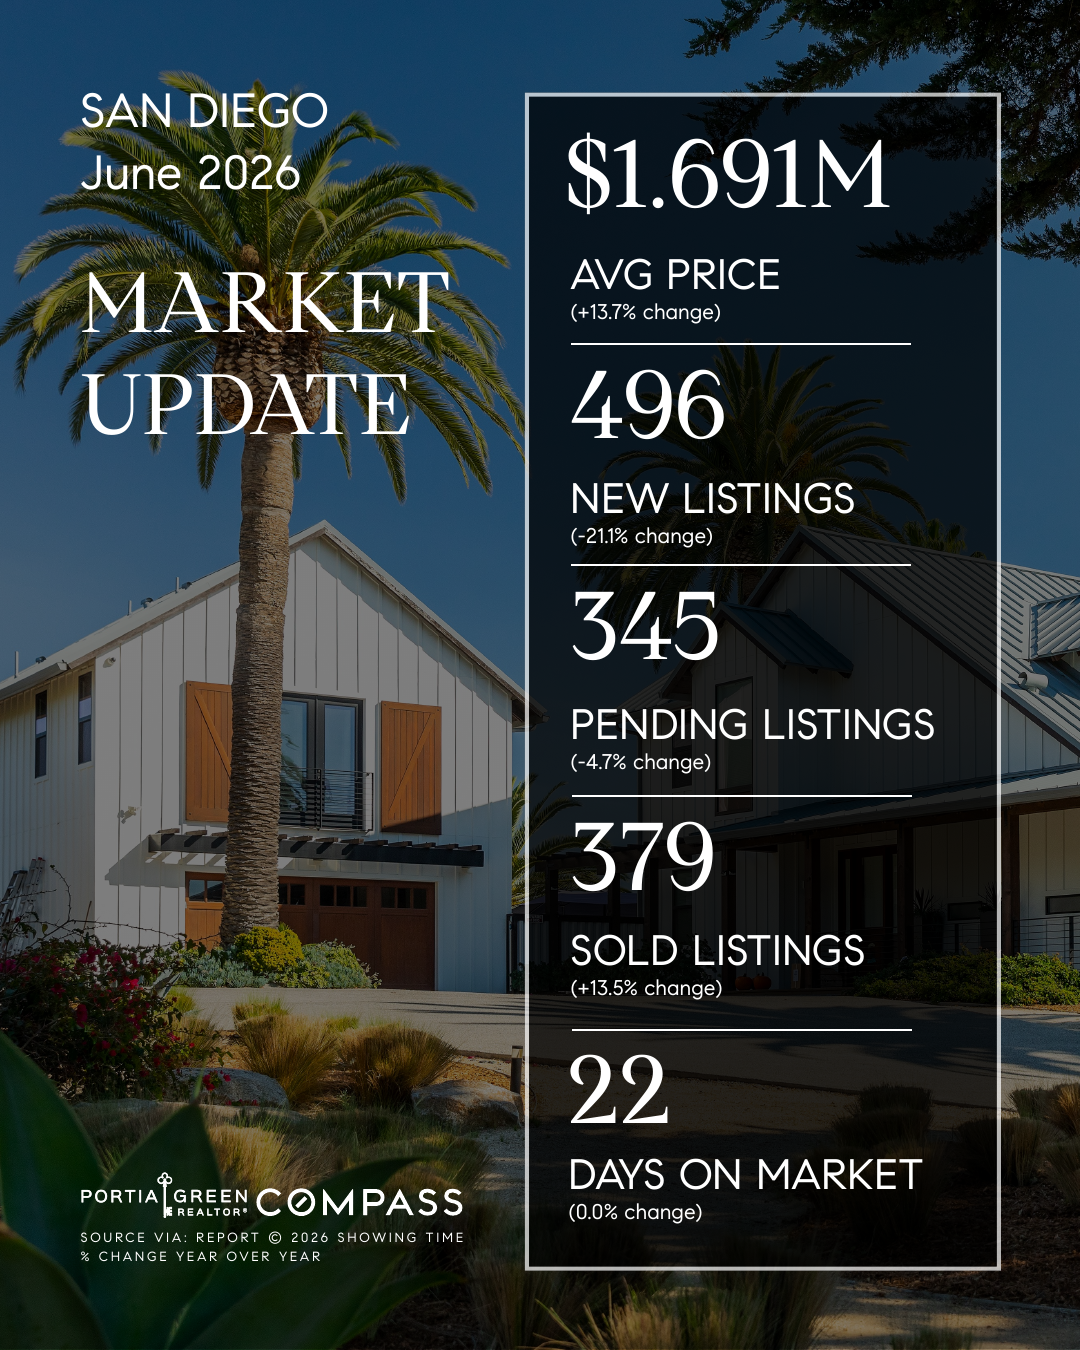
San Diego Housing Market Update — June 2026
• Sales Jump, Supply Remains Split • The San Diego housing market picked up speed in June, as closed sales climbed and new pending sales activity carried strong momentum into early summer.


Each week, typically on Thursdays, we release a fresh dataset to keep you up-to-date on the newest developments in the San Diego housing market. Stay tuned here for the latest data & commentary on how economic changes are impacting real estate in San Diego.
This data is subject to revisions weekly and should be viewed with caution. If there are any concerns about the data or questions about metric definitions, please reach out for quick & easy clarification. You can download a copy of the full dataset here.

Select the tab for the type of data that you’re looking for. Under each tab, you can filter results by metropolitan area, property type, month-over-month change, year-over-year change, and the time period. Each visualization will change with your selections.
After making your selections, click on the visualization and then hit the download button on the bottom right corner to save the data shown. Alternatively, you can select the “Download” tab and download all of the data that we have available.


• Sales Jump, Supply Remains Split • The San Diego housing market picked up speed in June, as closed sales climbed and new pending sales activity carried strong momentum into early summer.

• Build Lasting Value • Smart home improvements pave the way for a massive win when you eventually sell. While any thoughtful renovation breathes fresh life into your daily routine, specific high-value projects do double duty.

• 2026 Fireworks Schedule • This is your quick guide to the best San Diego fireworks shows across the county. Watch the sky burst into color from your favorite viewpoint this Fourth of July and unwind in a warm evening breeze.

• Contracts Surge, Inventory Splits • The San Diego housing market rallied in May, as pending sales activity spiked and inventory conditions veered between detached homes & attached units.

• Built to Lead • Five years at the top proves you’ve trusted Compass to guide your biggest moves for half a decade.
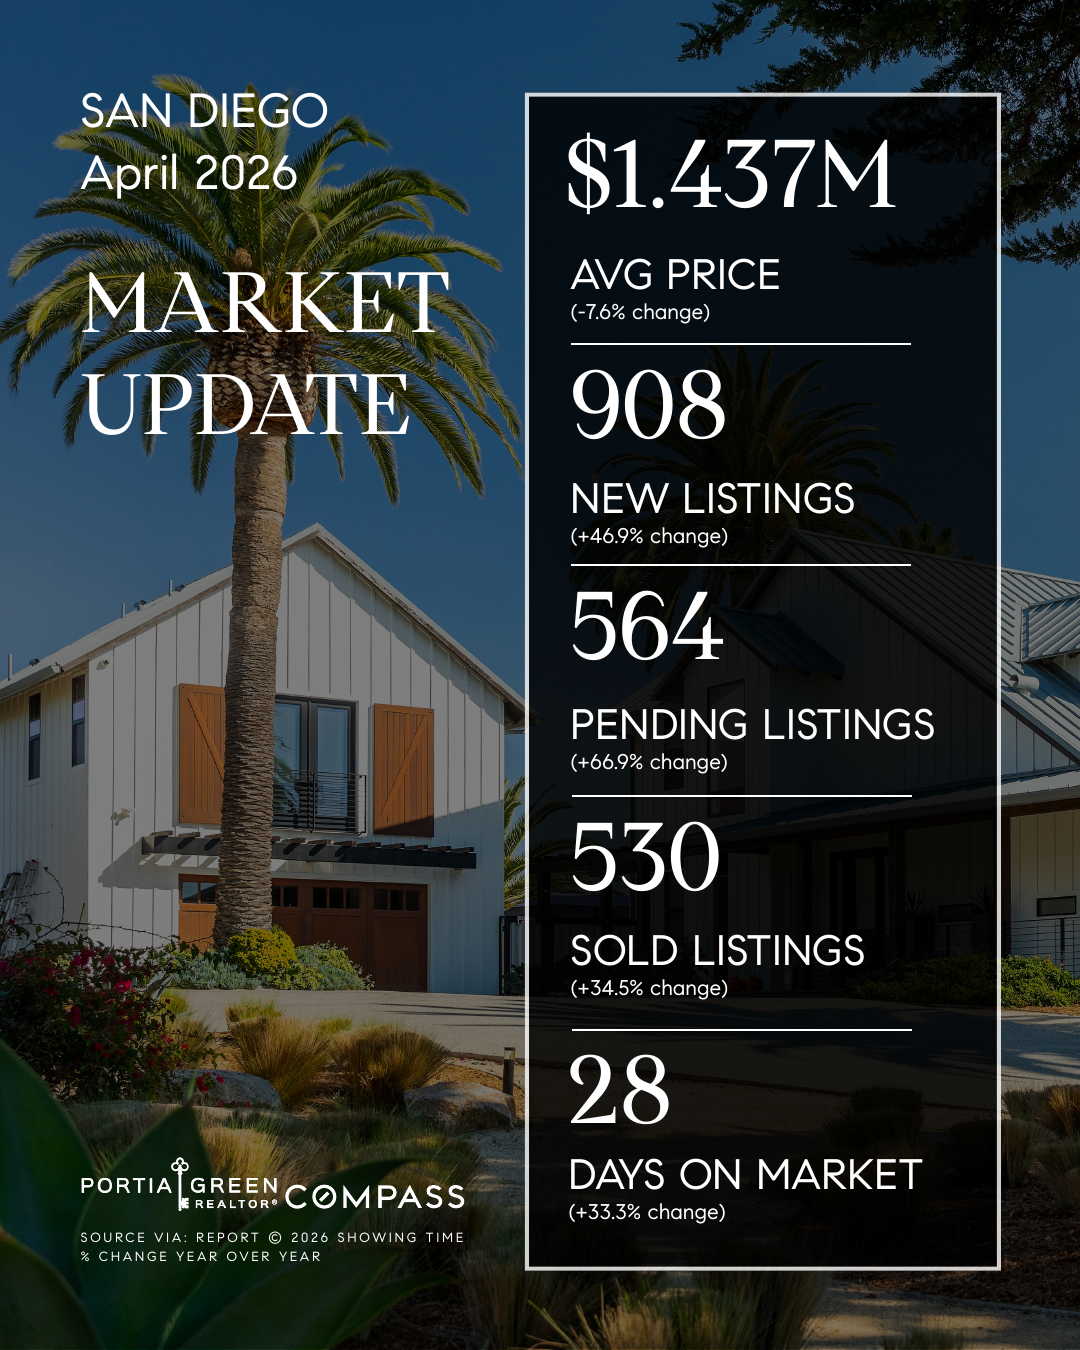
• Pending Sales Rise, Supply Improves • Spring momentum carried further into the San Diego housing market during April, with pending sales activity climbing across both detached homes and condos.